Advertisement
- Germany
- /
- Semiconductors
- /
- XTRA:P4O
European Penny Stocks: Libertas 7 And Two More Promising Picks

Simply Wall St
Reviewed by Simply Wall St
As European markets navigate a landscape of mixed monetary policy decisions and economic indicators, investors are keenly assessing opportunities across various sectors. Penny stocks, though often perceived as relics of past trading eras, continue to present unique investment prospects by spotlighting smaller or less-established companies with potential for significant returns. By focusing on those with robust financial foundations and clear growth trajectories, investors can uncover hidden value in these intriguing market segments.
Top 10 Penny Stocks In Europe
| Name | Share Price | Market Cap | Rewards & Risks |
| Ariston Holding (BIT:ARIS) | €4.23 | €1.46B | ✅ 4 ⚠️ 2 View Analysis > |
| Lucisano Media Group (BIT:LMG) | €1.08 | €16.04M | ✅ 3 ⚠️ 4 View Analysis > |
| Angler Gaming (NGM:ANGL) | SEK3.60 | SEK269.95M | ✅ 4 ⚠️ 2 View Analysis > |
| Angler Gaming (DB:0QM) | €0.37 | €228.7M | ✅ 2 ⚠️ 2 View Analysis > |
| Siili Solutions Oyj (HLSE:SIILI) | €4.96 | €40.22M | ✅ 3 ⚠️ 3 View Analysis > |
| IAMBA Arad (BVB:FERO) | RON0.486 | RON16.37M | ✅ 2 ⚠️ 4 View Analysis > |
| Euroland Société anonyme (ENXTPA:ALERO) | €3.20 | €10.15M | ✅ 2 ⚠️ 5 View Analysis > |
| ForFarmers (ENXTAM:FFARM) | €4.50 | €397.73M | ✅ 4 ⚠️ 1 View Analysis > |
| Deceuninck (ENXTBR:DECB) | €2.05 | €283.35M | ✅ 4 ⚠️ 1 View Analysis > |
| Netgem (ENXTPA:ALNTG) | €0.902 | €30.42M | ✅ 2 ⚠️ 2 View Analysis > |
Click here to see the full list of 328 stocks from our European Penny Stocks screener.
Underneath we present a selection of stocks filtered out by our screen.
Libertas 7 (BME:LIB)
Simply Wall St Financial Health Rating: ★★★★★☆
Overview: Libertas 7, S.A. operates in the real estate and investment sectors in Spain with a market capitalization of €64.91 million.
Operations: The company generates revenue from three main segments: Investments (€2.82 million), Touristic Area (€1.93 million), and Real Estate Area (€7.22 million).
Market Cap: €64.91M
Libertas 7 has shown significant improvement in its financial performance, reporting €9.15 million in sales for the first half of 2025, up from €2.68 million the previous year, and achieving a net income of €1.35 million compared to a loss last year. The company has reduced its debt-to-equity ratio over time and maintains strong interest coverage with EBIT at 6.2 times interest payments. However, its operating cash flow covers only 11% of debt, indicating room for improvement in liquidity management. Despite high earnings volatility and low return on equity at 3.6%, it trades below estimated fair value by nearly half.
- Click here and access our complete financial health analysis report to understand the dynamics of Libertas 7.
- Evaluate Libertas 7's prospects by accessing our earnings growth report.
Bergen Carbon Solutions (OB:BCS)
Simply Wall St Financial Health Rating: ★★★★★☆
Overview: Bergen Carbon Solutions AS is a Norwegian clean carbon technology and materials company with a market cap of NOK180.47 million.
Operations: Bergen Carbon Solutions AS has not reported any revenue segments.
Market Cap: NOK180.47M
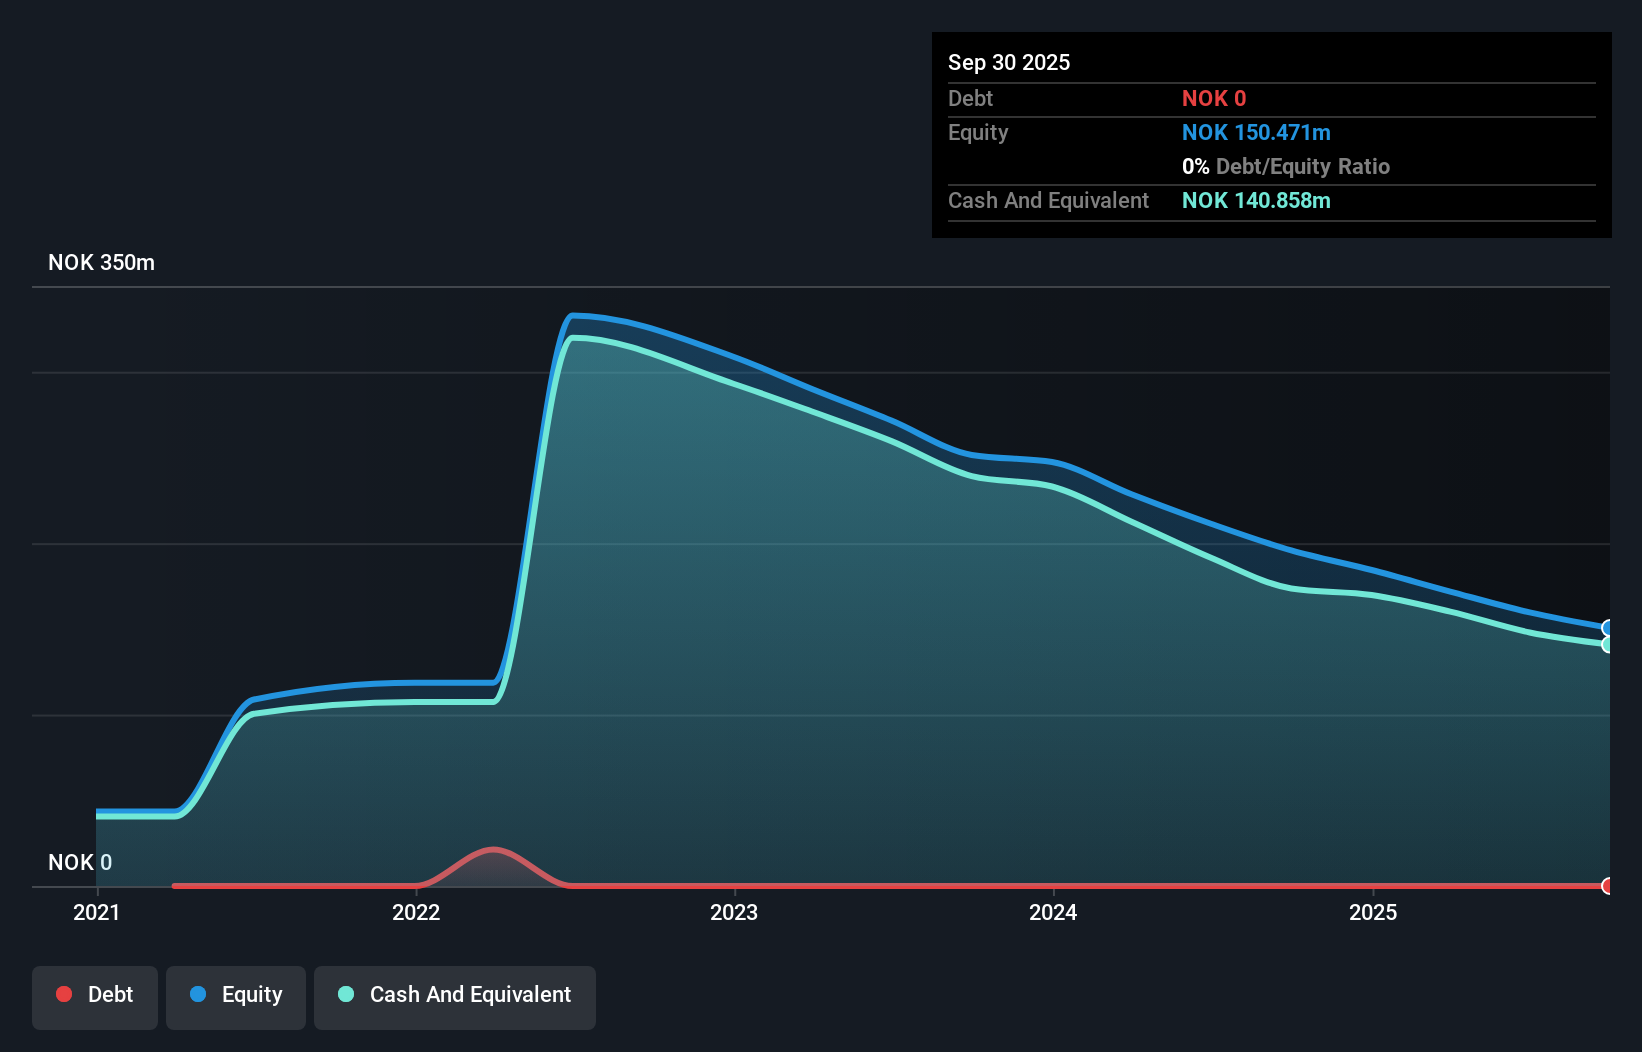
Bergen Carbon Solutions AS, a Norwegian clean carbon technology company with a market cap of NOK180.47 million, is currently pre-revenue with earnings results showing a net loss of NOK 12.75 million for Q2 2025, an improvement from the previous year's loss. The company has no debt and its short-term assets significantly exceed both short and long-term liabilities, providing financial stability despite being unprofitable. Its stock price has been highly volatile recently but trades well below estimated fair value. The management team is experienced; however, the board lacks seasoned leadership with an average tenure of 2.2 years.
- Unlock comprehensive insights into our analysis of Bergen Carbon Solutions stock in this financial health report.
- Explore Bergen Carbon Solutions' analyst forecasts in our growth report.
Planoptik (XTRA:P4O)
Simply Wall St Financial Health Rating: ★★★★★★
Overview: Planoptik AG manufactures and sells structured wafers in Germany, with a market capitalization of €19.06 million.
Operations: The company generates revenue of €11.94 million from its Glass & Clay Products segment.
Market Cap: €19.06M
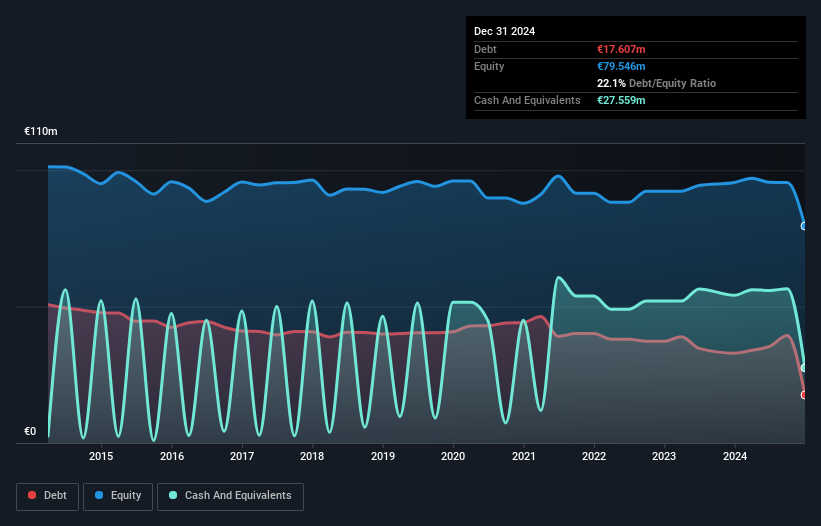
Planoptik AG, with a market cap of €19.06 million, generates €11.94 million in revenue from its Glass & Clay Products segment. The company's financial health is supported by more cash than total debt and short-term assets of €11.5 million surpassing both short-term (€2.6M) and long-term liabilities (€1.2M). Although recent earnings growth was negative at -58%, Planoptik has achieved significant profit growth over the past five years at 35.1% annually, despite current net profit margins declining to 5.9%. The board is seasoned with an average tenure of 10.3 years, adding stability amidst volatility concerns.
- Jump into the full analysis health report here for a deeper understanding of Planoptik.
- Assess Planoptik's previous results with our detailed historical performance reports.

Next Steps
- Reveal the 328 hidden gems among our European Penny Stocks screener with a single click here.
- Interested In Other Possibilities? Explore 26 top quantum computing companies leading the revolution in next-gen technology and shaping the future with breakthroughs in quantum algorithms, superconducting qubits, and cutting-edge research.
This article by Simply Wall St is general in nature. We provide commentary based on historical data and analyst forecasts only using an unbiased methodology and our articles are not intended to be financial advice. It does not constitute a recommendation to buy or sell any stock, and does not take account of your objectives, or your financial situation. We aim to bring you long-term focused analysis driven by fundamental data. Note that our analysis may not factor in the latest price-sensitive company announcements or qualitative material. Simply Wall St has no position in any stocks mentioned.
New: Manage All Your Stock Portfolios in One Place
We've created the ultimate portfolio companion for stock investors, and it's free.
• Connect an unlimited number of Portfolios and see your total in one currency
• Be alerted to new Warning Signs or Risks via email or mobile
• Track the Fair Value of your stocks
Have feedback on this article? Concerned about the content? Get in touch with us directly. Alternatively, email editorial-team@simplywallst.com
About XTRA:P4O
Flawless balance sheet with questionable track record.
Market Insights

Advertisement
Community Narratives
MINISO's fair value is projected at 26.69 with an anticipated PE ratio shift of 20x
Fair Value US$24.03|9.0% undervalued
BE
Community Contributor
Procter & Gamble: A Dividend Giant Facing Slowing Growth
Fair Value US$119.81|23.5% overvalued
AN
Community Contributor
Eli Lilly's Future Growth Driven by Tirzepatide and Favorable Market Conditions
Fair Value US$1.19k|14.4% undervalued
EA
Community Contributor