
Advertisement
If we want to find a potential multi-bagger, often there are underlying trends that can provide clues. Typically, we'll want to notice a trend of growing return on capital employed (ROCE) and alongside that, an expanding base of capital employed. This shows us that it's a compounding machine, able to continually reinvest its earnings back into the business and generate higher returns. Although, when we looked at Weng Fine Art (FRA:WFA), it didn't seem to tick all of these boxes.
Understanding Return On Capital Employed (ROCE)
For those that aren't sure what ROCE is, it measures the amount of pre-tax profits a company can generate from the capital employed in its business. To calculate this metric for Weng Fine Art, this is the formula:
Return on Capital Employed = Earnings Before Interest and Tax (EBIT) ÷ (Total Assets - Current Liabilities)
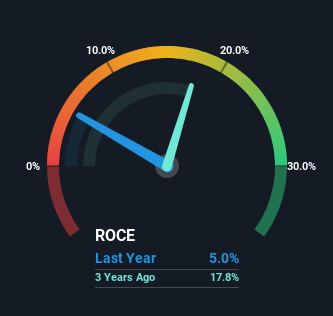
0.05 = €1.3m ÷ (€31m - €4.0m) (Based on the trailing twelve months to June 2023).
Therefore, Weng Fine Art has an ROCE of 5.0%. In absolute terms, that's a low return but it's around the Specialty Retail industry average of 4.2%.
Check out our latest analysis for Weng Fine Art
While the past is not representative of the future, it can be helpful to know how a company has performed historically, which is why we have this chart above. If you're interested in investigating Weng Fine Art's past further, check out this free graph of past earnings, revenue and cash flow.
The Trend Of ROCE
In terms of Weng Fine Art's historical ROCE movements, the trend isn't fantastic. To be more specific, ROCE has fallen from 9.4% over the last five years. And considering revenue has dropped while employing more capital, we'd be cautious. If this were to continue, you might be looking at a company that is trying to reinvest for growth but is actually losing market share since sales haven't increased.
On a related note, Weng Fine Art has decreased its current liabilities to 13% of total assets. That could partly explain why the ROCE has dropped. What's more, this can reduce some aspects of risk to the business because now the company's suppliers or short-term creditors are funding less of its operations. Since the business is basically funding more of its operations with it's own money, you could argue this has made the business less efficient at generating ROCE.
The Bottom Line
From the above analysis, we find it rather worrisome that returns on capital and sales for Weng Fine Art have fallen, meanwhile the business is employing more capital than it was five years ago. And long term shareholders have watched their investments stay flat over the last five years. That being the case, unless the underlying trends revert to a more positive trajectory, we'd consider looking elsewhere.
One more thing: We've identified 3 warning signs with Weng Fine Art (at least 1 which is significant) , and understanding them would certainly be useful.
While Weng Fine Art isn't earning the highest return, check out this free list of companies that are earning high returns on equity with solid balance sheets.
Valuation is complex, but we're here to simplify it.
Discover if Weng Fine Art might be undervalued or overvalued with our detailed analysis, featuring fair value estimates, potential risks, dividends, insider trades, and its financial condition.
Access Free AnalysisHave feedback on this article? Concerned about the content? Get in touch with us directly. Alternatively, email editorial-team (at) simplywallst.com.
This article by Simply Wall St is general in nature. We provide commentary based on historical data and analyst forecasts only using an unbiased methodology and our articles are not intended to be financial advice. It does not constitute a recommendation to buy or sell any stock, and does not take account of your objectives, or your financial situation. We aim to bring you long-term focused analysis driven by fundamental data. Note that our analysis may not factor in the latest price-sensitive company announcements or qualitative material. Simply Wall St has no position in any stocks mentioned.
About DB:WFA
Weng Fine Art
Operates as an art dealer primarily in Europe and the United States.
Mediocre balance sheet with low risk.
Market Insights

Advertisement
Community Narratives
Finding The True Value Of A Logistics Powerhouse
Fair Value US$95.21|8.4% undervalued
NV
Community Contributor
Paradigm Biopharmaceuticals Will Lead Osteoarthritis Treatment with Zilosul's FDA Success
Fair Value AU$5.50|91.9% undervalued
AM
Community Contributor
Barrick Mining (ABX:CA): A Gold Hedge against a U.S. Shutdown
Fair Value CA$60.00|24.2% undervalued
GM
Community Contributor