
Advertisement
- Germany
- /
- Specialty Stores
- /
- XTRA:WEW
Westwing Group SE's (ETR:WEW) 33% Share Price Surge Not Quite Adding Up
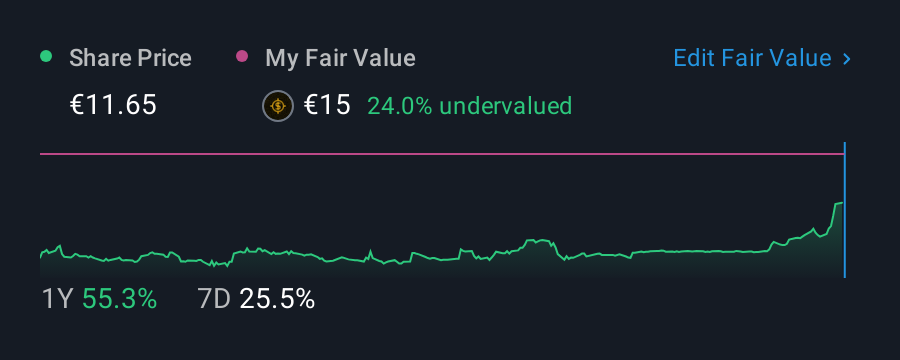
Westwing Group SE (ETR:WEW) shareholders have had their patience rewarded with a 33% share price jump in the last month. Looking back a bit further, it's encouraging to see the stock is up 39% in the last year.
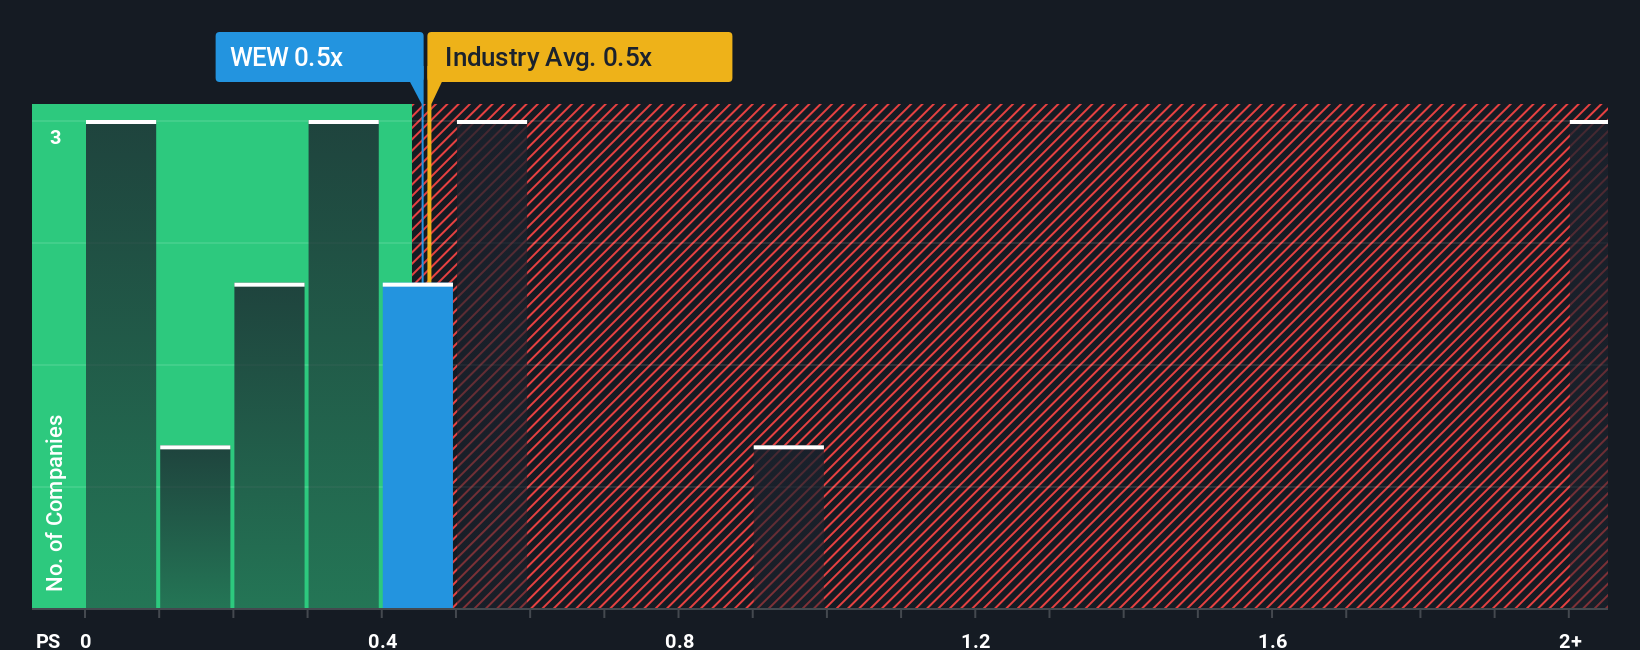
Although its price has surged higher, it's still not a stretch to say that Westwing Group's price-to-sales (or "P/S") ratio of 0.5x right now seems quite "middle-of-the-road" compared to the Specialty Retail industry in Germany, where the median P/S ratio is around 0.4x. While this might not raise any eyebrows, if the P/S ratio is not justified investors could be missing out on a potential opportunity or ignoring looming disappointment.
Check out our latest analysis for Westwing Group
How Westwing Group Has Been Performing
For example, consider that Westwing Group's financial performance has been pretty ordinary lately as revenue growth is non-existent. One possibility is that the P/S is moderate because investors think this benign revenue growth rate might not be enough to outperform the broader industry in the near future. Those who are bullish on Westwing Group will be hoping that this isn't the case, so that they can pick up the stock at a lower valuation.
Although there are no analyst estimates available for Westwing Group, take a look at this free data-rich visualisation to see how the company stacks up on earnings, revenue and cash flow.Do Revenue Forecasts Match The P/S Ratio?
There's an inherent assumption that a company should be matching the industry for P/S ratios like Westwing Group's to be considered reasonable.
Retrospectively, the last year delivered virtually the same number to the company's top line as the year before. Whilst it's an improvement, it wasn't enough to get the company out of the hole it was in, with revenue down 5.0% overall from three years ago. Therefore, it's fair to say the revenue growth recently has been undesirable for the company.
Comparing that to the industry, which is predicted to deliver 11% growth in the next 12 months, the company's downward momentum based on recent medium-term revenue results is a sobering picture.
In light of this, it's somewhat alarming that Westwing Group's P/S sits in line with the majority of other companies. It seems most investors are ignoring the recent poor growth rate and are hoping for a turnaround in the company's business prospects. Only the boldest would assume these prices are sustainable as a continuation of recent revenue trends is likely to weigh on the share price eventually.
The Final Word
Westwing Group's stock has a lot of momentum behind it lately, which has brought its P/S level with the rest of the industry. Using the price-to-sales ratio alone to determine if you should sell your stock isn't sensible, however it can be a practical guide to the company's future prospects.
Our look at Westwing Group revealed its shrinking revenues over the medium-term haven't impacted the P/S as much as we anticipated, given the industry is set to grow. Even though it matches the industry, we're uncomfortable with the current P/S ratio, as this dismal revenue performance is unlikely to support a more positive sentiment for long. Unless the recent medium-term conditions improve markedly, investors will have a hard time accepting the share price as fair value.
The company's balance sheet is another key area for risk analysis. Our free balance sheet analysis for Westwing Group with six simple checks will allow you to discover any risks that could be an issue.
Of course, profitable companies with a history of great earnings growth are generally safer bets. So you may wish to see this free collection of other companies that have reasonable P/E ratios and have grown earnings strongly.
Valuation is complex, but we're here to simplify it.
Discover if Westwing Group might be undervalued or overvalued with our detailed analysis, featuring fair value estimates, potential risks, dividends, insider trades, and its financial condition.
Access Free AnalysisHave feedback on this article? Concerned about the content? Get in touch with us directly. Alternatively, email editorial-team (at) simplywallst.com.
This article by Simply Wall St is general in nature. We provide commentary based on historical data and analyst forecasts only using an unbiased methodology and our articles are not intended to be financial advice. It does not constitute a recommendation to buy or sell any stock, and does not take account of your objectives, or your financial situation. We aim to bring you long-term focused analysis driven by fundamental data. Note that our analysis may not factor in the latest price-sensitive company announcements or qualitative material. Simply Wall St has no position in any stocks mentioned.
About XTRA:WEW
Flawless balance sheet with high growth potential.
Similar Companies
Market Insights

Advertisement
Community Narratives
MINISO's fair value is projected at 26.69 with an anticipated PE ratio shift of 20x
Fair Value US$24.03|11.0% undervalued
BE
Community Contributor
Procter & Gamble: A Dividend Giant Facing Slowing Growth
Fair Value US$119.81|23.3% overvalued
AN
Community Contributor
Eli Lilly's Future Growth Driven by Tirzepatide and Favorable Market Conditions
Fair Value US$1.19k|13.8% undervalued
EA
Community Contributor