
Advertisement
There are a few key trends to look for if we want to identify the next multi-bagger. Firstly, we'd want to identify a growing return on capital employed (ROCE) and then alongside that, an ever-increasing base of capital employed. This shows us that it's a compounding machine, able to continually reinvest its earnings back into the business and generate higher returns. With that in mind, the ROCE of Fielmann Group (ETR:FIE) looks decent, right now, so lets see what the trend of returns can tell us.
What Is Return On Capital Employed (ROCE)?
For those that aren't sure what ROCE is, it measures the amount of pre-tax profits a company can generate from the capital employed in its business. Analysts use this formula to calculate it for Fielmann Group:
Return on Capital Employed = Earnings Before Interest and Tax (EBIT) ÷ (Total Assets - Current Liabilities)
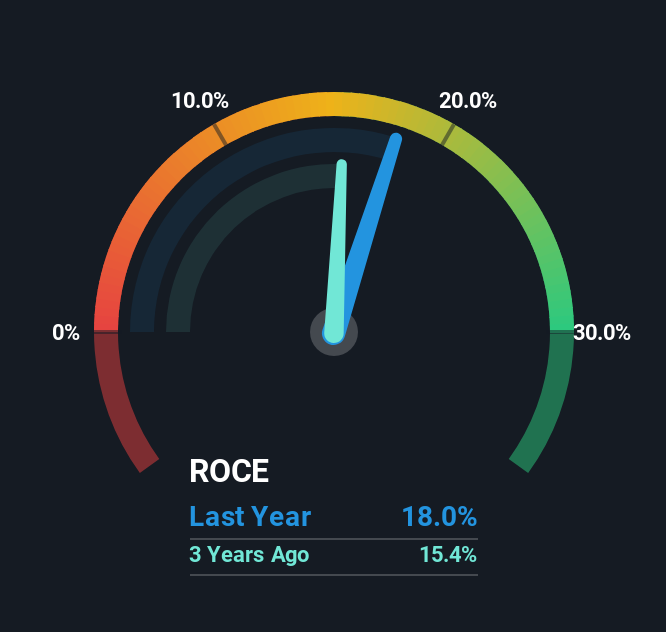
0.18 = €273m ÷ (€2.4b - €847m) (Based on the trailing twelve months to March 2025).
Therefore, Fielmann Group has an ROCE of 18%. In absolute terms, that's a satisfactory return, but compared to the Specialty Retail industry average of 9.4% it's much better.
See our latest analysis for Fielmann Group
Above you can see how the current ROCE for Fielmann Group compares to its prior returns on capital, but there's only so much you can tell from the past. If you'd like to see what analysts are forecasting going forward, you should check out our free analyst report for Fielmann Group .
What Can We Tell From Fielmann Group's ROCE Trend?
While the current returns on capital are decent, they haven't changed much. The company has consistently earned 18% for the last five years, and the capital employed within the business has risen 42% in that time. 18% is a pretty standard return, and it provides some comfort knowing that Fielmann Group has consistently earned this amount. Stable returns in this ballpark can be unexciting, but if they can be maintained over the long run, they often provide nice rewards to shareholders.
Another point to note, we noticed the company has increased current liabilities over the last five years. This is intriguing because if current liabilities hadn't increased to 36% of total assets, this reported ROCE would probably be less than18% because total capital employed would be higher.The 18% ROCE could be even lower if current liabilities weren't 36% of total assets, because the the formula would show a larger base of total capital employed. With that in mind, just be wary if this ratio increases in the future, because if it gets particularly high, this brings with it some new elements of risk.
Our Take On Fielmann Group's ROCE
In the end, Fielmann Group has proven its ability to adequately reinvest capital at good rates of return. In light of this, the stock has only gained 2.4% over the last five years for shareholders who have owned the stock in this period. That's why it could be worth your time looking into this stock further to discover if it has more traits of a multi-bagger.
Like most companies, Fielmann Group does come with some risks, and we've found 2 warning signs that you should be aware of.
While Fielmann Group isn't earning the highest return, check out this free list of companies that are earning high returns on equity with solid balance sheets.
New: AI Stock Screener & Alerts
Our new AI Stock Screener scans the market every day to uncover opportunities.
• Dividend Powerhouses (3%+ Yield)
• Undervalued Small Caps with Insider Buying
• High growth Tech and AI Companies
Or build your own from over 50 metrics.
Have feedback on this article? Concerned about the content? Get in touch with us directly. Alternatively, email editorial-team (at) simplywallst.com.
This article by Simply Wall St is general in nature. We provide commentary based on historical data and analyst forecasts only using an unbiased methodology and our articles are not intended to be financial advice. It does not constitute a recommendation to buy or sell any stock, and does not take account of your objectives, or your financial situation. We aim to bring you long-term focused analysis driven by fundamental data. Note that our analysis may not factor in the latest price-sensitive company announcements or qualitative material. Simply Wall St has no position in any stocks mentioned.
About XTRA:FIE
Fielmann Group
Engages in vision care and audiology business in Germany, Switzerland, Austria, Spain, North America, and internationally.
Solid track record and good value.
Similar Companies
Market Insights

Advertisement
Community Narratives
MicroVision will explode future revenue by 380.37% with a vision towards success
Fair Value US$60|98.4% undervalued
TH
Community Contributor
The Indispensable Artery for a New North American Economy
Fair Value CA$132.87|3.6% undervalued
TI
Community Contributor
Recently Updated Narratives
BE


Bejgal on MINISO Group Holding ·
MINISO's fair value is projected at 26.69 with an anticipated PE ratio shift of 20x
Fair Value:US$26.6927.9% undervalued
44 followersusers have followed this narrative
3 commentsusers have commented on this narrative
0 likesusers have liked this narrative
TI


TickerTickle on Oracle ·
The Quiet Giant That Became AI’s Power Grid
Fair Value:US$389.8148.6% undervalued
6 followersusers have followed this narrative
0 commentsusers have commented on this narrative
0 likesusers have liked this narrative
AU

AuCA on Nova Ljubljanska Banka d.d ·
Nova Ljubljanska Banka d.d will expect a 11.2% revenue boost driving future growth
Fair Value:€20916.3% undervalued
23 followersusers have followed this narrative
3 commentsusers have commented on this narrative
0 likesusers have liked this narrative
Popular Narratives
OS


oscargarcia on Alphabet ·
The company that turned a verb into a global necessity and basically runs the modern internet, digital ads, smartphones, maps, and AI.
Fair Value:US$3406.3% undervalued
130 followersusers have followed this narrative
6 commentsusers have commented on this narrative
17 likesusers have liked this narrative
TH

TheWallstreetKing on MicroVision ·
MicroVision will explode future revenue by 380.37% with a vision towards success
Fair Value:US$6098.4% undervalued
81 followersusers have followed this narrative
10 commentsusers have commented on this narrative
18 likesusers have liked this narrative
AN


AnalystConsensusTarget on NVIDIA ·
NVDA: Expanding AI Demand Will Drive Major Data Center Investments Through 2026
Fair Value:US$232.7921.6% undervalued
919 followersusers have followed this narrative
5 commentsusers have commented on this narrative
21 likesusers have liked this narrative