
Advertisement
IBU-tec advanced materials AG (ETR:IBU) Soars 28% But It's A Story Of Risk Vs Reward
IBU-tec advanced materials AG (ETR:IBU) shares have had a really impressive month, gaining 28% after a shaky period beforehand. Not all shareholders will be feeling jubilant, since the share price is still down a very disappointing 40% in the last twelve months.
Although its price has surged higher, you could still be forgiven for feeling indifferent about IBU-tec advanced materials' P/S ratio of 1.1x, since the median price-to-sales (or "P/S") ratio for the Chemicals industry in Germany is also close to 0.7x. Although, it's not wise to simply ignore the P/S without explanation as investors may be disregarding a distinct opportunity or a costly mistake.
Check out our latest analysis for IBU-tec advanced materials
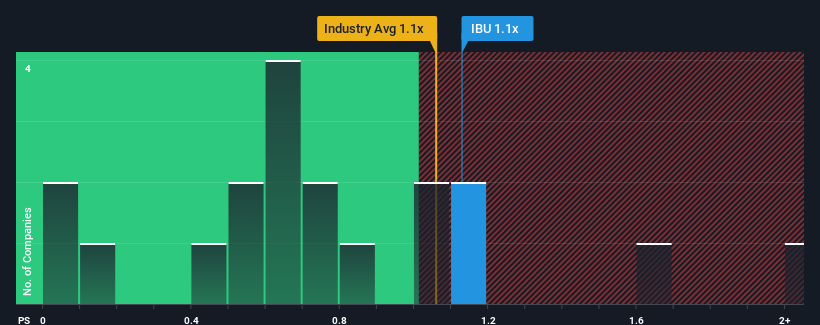
What Does IBU-tec advanced materials' Recent Performance Look Like?
With only a limited decrease in revenue compared to most other companies of late, IBU-tec advanced materials has been doing relatively well. Perhaps the market is expecting future revenue performance fall back in line with the poorer industry performance, which has kept the P/S contained. You'd much rather the company continue improving its revenue if you still believe in the business. But at the very least, you'd be hoping the company doesn't fall back into the pack if your plan is to pick up some stock while it's not in favour.
Keen to find out how analysts think IBU-tec advanced materials' future stacks up against the industry? In that case, our free report is a great place to start.Do Revenue Forecasts Match The P/S Ratio?
There's an inherent assumption that a company should be matching the industry for P/S ratios like IBU-tec advanced materials' to be considered reasonable.
In reviewing the last year of financials, we were disheartened to see the company's revenues fell to the tune of 2.5%. That put a dampener on the good run it was having over the longer-term as its three-year revenue growth is still a noteworthy 26% in total. Although it's been a bumpy ride, it's still fair to say the revenue growth recently has been mostly respectable for the company.
Turning to the outlook, the next year should generate growth of 23% as estimated by the lone analyst watching the company. Meanwhile, the rest of the industry is forecast to only expand by 3.6%, which is noticeably less attractive.
With this in consideration, we find it intriguing that IBU-tec advanced materials' P/S is closely matching its industry peers. It may be that most investors aren't convinced the company can achieve future growth expectations.
The Final Word
Its shares have lifted substantially and now IBU-tec advanced materials' P/S is back within range of the industry median. We'd say the price-to-sales ratio's power isn't primarily as a valuation instrument but rather to gauge current investor sentiment and future expectations.
Looking at IBU-tec advanced materials' analyst forecasts revealed that its superior revenue outlook isn't giving the boost to its P/S that we would've expected. When we see a strong revenue outlook, with growth outpacing the industry, we can only assume potential uncertainty around these figures are what might be placing slight pressure on the P/S ratio. At least the risk of a price drop looks to be subdued, but investors seem to think future revenue could see some volatility.
Having said that, be aware IBU-tec advanced materials is showing 2 warning signs in our investment analysis, you should know about.
If strong companies turning a profit tickle your fancy, then you'll want to check out this free list of interesting companies that trade on a low P/E (but have proven they can grow earnings).
New: AI Stock Screener & Alerts
Our new AI Stock Screener scans the market every day to uncover opportunities.
• Dividend Powerhouses (3%+ Yield)
• Undervalued Small Caps with Insider Buying
• High growth Tech and AI Companies
Or build your own from over 50 metrics.
Have feedback on this article? Concerned about the content? Get in touch with us directly. Alternatively, email editorial-team (at) simplywallst.com.
This article by Simply Wall St is general in nature. We provide commentary based on historical data and analyst forecasts only using an unbiased methodology and our articles are not intended to be financial advice. It does not constitute a recommendation to buy or sell any stock, and does not take account of your objectives, or your financial situation. We aim to bring you long-term focused analysis driven by fundamental data. Note that our analysis may not factor in the latest price-sensitive company announcements or qualitative material. Simply Wall St has no position in any stocks mentioned.
About XTRA:IBU
IBU-tec advanced materials
Offers services and products for the chemical industry Germany, rest of Europe, and internationally.
Excellent balance sheet with limited growth.
Market Insights

Advertisement
Community Narratives
The company that turned a verb into a global necessity and basically runs the modern internet, digital ads, smartphones, maps, and AI.
Fair Value US$300.00|5.2% undervalued
OS
Community Contributor
Flowers Foods Pays A Fair Price For Health
Fair Value US$16.12|24.9% undervalued
NV
Community Contributor
TMX Group will thrive with 33.3% profit margin and enduring market moat
Fair Value CA$49.90|3.3% overvalued
LI
Community Contributor
The "Molecular Pencil": Why Beam's Technology is Built to Win
Fair Value US$65.01|64.5% undervalued
DA
Community Contributor