
Advertisement
Investors Met With Slowing Returns on Capital At Evonik Industries (ETR:EVK)
Finding a business that has the potential to grow substantially is not easy, but it is possible if we look at a few key financial metrics. Firstly, we'd want to identify a growing return on capital employed (ROCE) and then alongside that, an ever-increasing base of capital employed. If you see this, it typically means it's a company with a great business model and plenty of profitable reinvestment opportunities. In light of that, when we looked at Evonik Industries (ETR:EVK) and its ROCE trend, we weren't exactly thrilled.
What Is Return On Capital Employed (ROCE)?
Just to clarify if you're unsure, ROCE is a metric for evaluating how much pre-tax income (in percentage terms) a company earns on the capital invested in its business. To calculate this metric for Evonik Industries, this is the formula:
Return on Capital Employed = Earnings Before Interest and Tax (EBIT) ÷ (Total Assets - Current Liabilities)
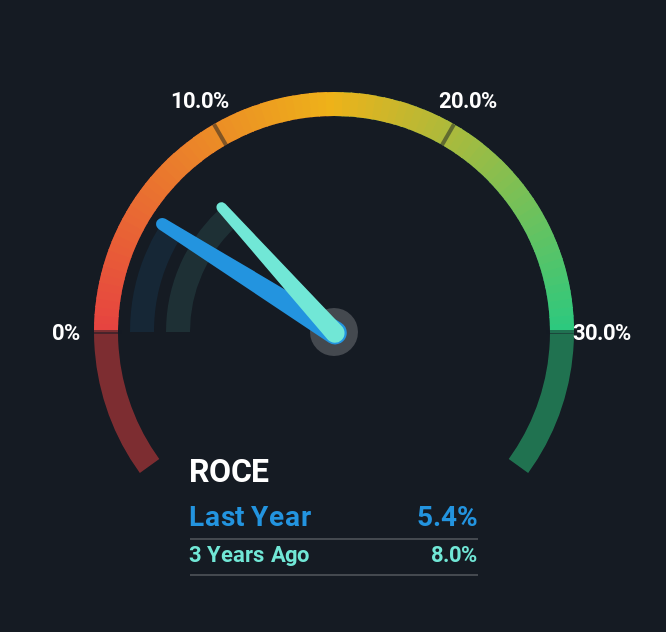
0.054 = €813m ÷ (€19b - €3.9b) (Based on the trailing twelve months to June 2025).
Thus, Evonik Industries has an ROCE of 5.4%. On its own, that's a low figure but it's around the 6.4% average generated by the Chemicals industry.
See our latest analysis for Evonik Industries
Above you can see how the current ROCE for Evonik Industries compares to its prior returns on capital, but there's only so much you can tell from the past. If you're interested, you can view the analysts predictions in our free analyst report for Evonik Industries .
So How Is Evonik Industries' ROCE Trending?
Over the past five years, Evonik Industries' ROCE and capital employed have both remained mostly flat. It's not uncommon to see this when looking at a mature and stable business that isn't re-investing its earnings because it has likely passed that phase of the business cycle. With that in mind, unless investment picks up again in the future, we wouldn't expect Evonik Industries to be a multi-bagger going forward. That being the case, it makes sense that Evonik Industries has been paying out 63% of its earnings to its shareholders. Most shareholders probably know this and own the stock for its dividend.
What We Can Learn From Evonik Industries' ROCE
In a nutshell, Evonik Industries has been trudging along with the same returns from the same amount of capital over the last five years. Additionally, the stock's total return to shareholders over the last five years has been flat, which isn't too surprising. On the whole, we aren't too inspired by the underlying trends and we think there may be better chances of finding a multi-bagger elsewhere.
If you'd like to know about the risks facing Evonik Industries, we've discovered 1 warning sign that you should be aware of.
While Evonik Industries isn't earning the highest return, check out this free list of companies that are earning high returns on equity with solid balance sheets.
Valuation is complex, but we're here to simplify it.
Discover if Evonik Industries might be undervalued or overvalued with our detailed analysis, featuring fair value estimates, potential risks, dividends, insider trades, and its financial condition.
Access Free AnalysisHave feedback on this article? Concerned about the content? Get in touch with us directly. Alternatively, email editorial-team (at) simplywallst.com.
This article by Simply Wall St is general in nature. We provide commentary based on historical data and analyst forecasts only using an unbiased methodology and our articles are not intended to be financial advice. It does not constitute a recommendation to buy or sell any stock, and does not take account of your objectives, or your financial situation. We aim to bring you long-term focused analysis driven by fundamental data. Note that our analysis may not factor in the latest price-sensitive company announcements or qualitative material. Simply Wall St has no position in any stocks mentioned.
About XTRA:EVK
Evonik Industries
Produces and sells specialty chemicals in the Asia-Pacific, Europe, the Middle East, Africa, Central and South America, and North America.
Adequate balance sheet average dividend payer.
Similar Companies
Market Insights

Advertisement
Community Narratives
MINISO's fair value is projected at 26.69 with an anticipated PE ratio shift of 20x
Fair Value US$24.03|9.0% undervalued
BE
Community Contributor
Procter & Gamble: A Dividend Giant Facing Slowing Growth
Fair Value US$119.81|23.5% overvalued
AN
Community Contributor
Eli Lilly's Future Growth Driven by Tirzepatide and Favorable Market Conditions
Fair Value US$1.19k|14.4% undervalued
EA
Community Contributor