
Advertisement
- Germany
- /
- Healthcare Services
- /
- HMSE:CLS1
Are Investors Concerned With What's Going On At McKesson Europe (HMSE:CLS1)?

When we're researching a company, it's sometimes hard to find the warning signs, but there are some financial metrics that can help spot trouble early. When we see a declining return on capital employed (ROCE) in conjunction with a declining base of capital employed, that's often how a mature business shows signs of aging. This combination can tell you that not only is the company investing less, it's earning less on what it does invest. So after we looked into McKesson Europe (HMSE:CLS1), the trends above didn't look too great.
Return On Capital Employed (ROCE): What is it?
Just to clarify if you're unsure, ROCE is a metric for evaluating how much pre-tax income (in percentage terms) a company earns on the capital invested in its business. The formula for this calculation on McKesson Europe is:
Return on Capital Employed = Earnings Before Interest and Tax (EBIT) ÷ (Total Assets - Current Liabilities)
0.024 = €83m ÷ (€7.1b - €3.7b) (Based on the trailing twelve months to March 2019).
So, McKesson Europe has an ROCE of 2.4%. In absolute terms, that's a low return and it also under-performs the Healthcare industry average of 6.6%.
Check out our latest analysis for McKesson Europe
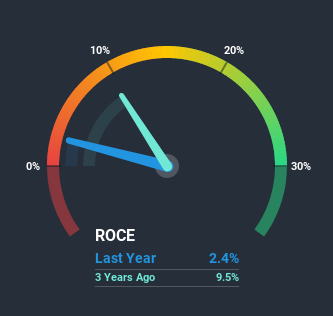
Historical performance is a great place to start when researching a stock so above you can see the gauge for McKesson Europe's ROCE against it's prior returns. If you want to delve into the historical earnings, revenue and cash flow of McKesson Europe, check out these free graphs here.
What Can We Tell From McKesson Europe's ROCE Trend?
The trend of ROCE at McKesson Europe is showing some signs of weakness. Unfortunately, returns have declined substantially over the last five years to the 2.4% we see today. What's equally concerning is that the amount of capital deployed in the business has shrunk by 23% over that same period. The combination of lower ROCE and less capital employed can indicate that a business is likely to be facing some competitive headwinds or seeing an erosion to its moat. Typically businesses that exhibit these characteristics aren't the ones that tend to multiply over the long term, because statistically speaking, they've already gone through the growth phase of their life cycle.
On a side note, McKesson Europe's current liabilities are still rather high at 52% of total assets. This can bring about some risks because the company is basically operating with a rather large reliance on its suppliers or other sorts of short-term creditors. Ideally we'd like to see this reduce as that would mean fewer obligations bearing risks.The Bottom Line
To see McKesson Europe reducing the capital employed in the business in tandem with diminishing returns, is concerning. Despite the concerning underlying trends, the stock has actually gained 7.2% over the last three years, so it might be that the investors are expecting the trends to reverse. Regardless, we don't like the trends as they are and if they persist, we think you might find better investments elsewhere.
On a final note, we found 3 warning signs for McKesson Europe (1 is a bit concerning) you should be aware of.
For those who like to invest in solid companies, check out this free list of companies with solid balance sheets and high returns on equity.
If you decide to trade McKesson Europe, use the lowest-cost* platform that is rated #1 Overall by Barron’s, Interactive Brokers. Trade stocks, options, futures, forex, bonds and funds on 135 markets, all from a single integrated account.Promoted
New: Manage All Your Stock Portfolios in One Place
We've created the ultimate portfolio companion for stock investors, and it's free.
• Connect an unlimited number of Portfolios and see your total in one currency
• Be alerted to new Warning Signs or Risks via email or mobile
• Track the Fair Value of your stocks
This article by Simply Wall St is general in nature. It does not constitute a recommendation to buy or sell any stock, and does not take account of your objectives, or your financial situation. We aim to bring you long-term focused analysis driven by fundamental data. Note that our analysis may not factor in the latest price-sensitive company announcements or qualitative material. Simply Wall St has no position in any stocks mentioned.
*Interactive Brokers Rated Lowest Cost Broker by StockBrokers.com Annual Online Review 2020
Have feedback on this article? Concerned about the content? Get in touch with us directly. Alternatively, email editorial-team@simplywallst.com.
About HMSE:CLS1
McKesson Europe
McKesson Europe AG provides logistics and other services to the pharmaceutical and healthcare sectors worldwide.
Excellent balance sheet and overvalued.
Market Insights

Advertisement
Community Narratives
Vita Life Sciences Set for a 12.72% Revenue Growth While Tackling Operational Challenges
Fair Value AU$2.42|8.7% undervalued
RO
Community Contributor
Vossloh rides a €500 billion wave to boost growth and earnings in the next decade
Fair Value €78.41|6.3% undervalued
CH
Community Contributor
Intuitive Surgical Will Transform Healthcare with 12% Revenue Growth
Fair Value US$325.55|56.5% overvalued
UN
Community Contributor