Stock Analysis
- Germany
- /
- Healthtech
- /
- XTRA:NXU
Is Weakness In Nexus AG (ETR:NXU) Stock A Sign That The Market Could be Wrong Given Its Strong Financial Prospects?


It is hard to get excited after looking at Nexus' (ETR:NXU) recent performance, when its stock has declined 4.7% over the past week. However, stock prices are usually driven by a company’s financial performance over the long term, which in this case looks quite promising. Specifically, we decided to study Nexus' ROE in this article.
Return on Equity or ROE is a test of how effectively a company is growing its value and managing investors’ money. Put another way, it reveals the company's success at turning shareholder investments into profits.
View our latest analysis for Nexus
How To Calculate Return On Equity?
The formula for return on equity is:
Return on Equity = Net Profit (from continuing operations) ÷ Shareholders' Equity
So, based on the above formula, the ROE for Nexus is:
9.4% = €25m ÷ €264m (Based on the trailing twelve months to March 2024).
The 'return' is the profit over the last twelve months. So, this means that for every €1 of its shareholder's investments, the company generates a profit of €0.09.
What Has ROE Got To Do With Earnings Growth?
Thus far, we have learned that ROE measures how efficiently a company is generating its profits. Depending on how much of these profits the company reinvests or "retains", and how effectively it does so, we are then able to assess a company’s earnings growth potential. Assuming all else is equal, companies that have both a higher return on equity and higher profit retention are usually the ones that have a higher growth rate when compared to companies that don't have the same features.
A Side By Side comparison of Nexus' Earnings Growth And 9.4% ROE
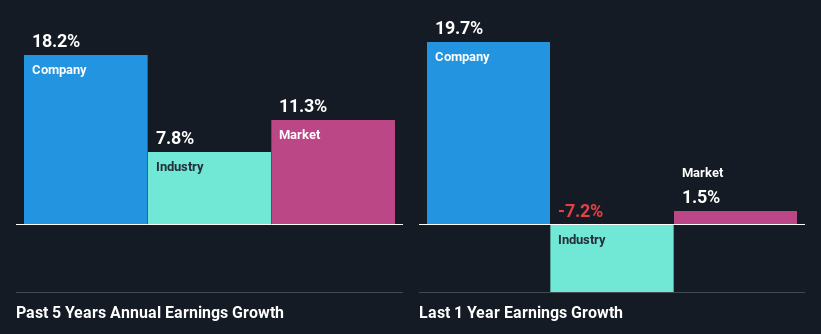
At first glance, Nexus seems to have a decent ROE. Especially when compared to the industry average of 7.4% the company's ROE looks pretty impressive. This certainly adds some context to Nexus' decent 18% net income growth seen over the past five years.
Next, on comparing with the industry net income growth, we found that Nexus' growth is quite high when compared to the industry average growth of 7.8% in the same period, which is great to see.
Earnings growth is an important metric to consider when valuing a stock. What investors need to determine next is if the expected earnings growth, or the lack of it, is already built into the share price. By doing so, they will have an idea if the stock is headed into clear blue waters or if swampy waters await. Is NXU fairly valued? This infographic on the company's intrinsic value has everything you need to know.
Is Nexus Making Efficient Use Of Its Profits?
In Nexus' case, its respectable earnings growth can probably be explained by its low three-year median payout ratio of 17% (or a retention ratio of 83%), which suggests that the company is investing most of its profits to grow its business.
Additionally, Nexus has paid dividends over a period of at least ten years which means that the company is pretty serious about sharing its profits with shareholders. Our latest analyst data shows that the future payout ratio of the company is expected to drop to 13% over the next three years. However, the company's ROE is not expected to change by much despite the lower expected payout ratio.
Conclusion
In total, we are pretty happy with Nexus' performance. Specifically, we like that the company is reinvesting a huge chunk of its profits at a high rate of return. This of course has caused the company to see substantial growth in its earnings. On studying current analyst estimates, we found that analysts expect the company to continue its recent growth streak. To know more about the latest analysts predictions for the company, check out this visualization of analyst forecasts for the company.
Valuation is complex, but we're helping make it simple.
Find out whether Nexus is potentially over or undervalued by checking out our comprehensive analysis, which includes fair value estimates, risks and warnings, dividends, insider transactions and financial health.
View the Free AnalysisHave feedback on this article? Concerned about the content? Get in touch with us directly. Alternatively, email editorial-team (at) simplywallst.com.
This article by Simply Wall St is general in nature. We provide commentary based on historical data and analyst forecasts only using an unbiased methodology and our articles are not intended to be financial advice. It does not constitute a recommendation to buy or sell any stock, and does not take account of your objectives, or your financial situation. We aim to bring you long-term focused analysis driven by fundamental data. Note that our analysis may not factor in the latest price-sensitive company announcements or qualitative material. Simply Wall St has no position in any stocks mentioned.
Valuation is complex, but we're helping make it simple.
Find out whether Nexus is potentially over or undervalued by checking out our comprehensive analysis, which includes fair value estimates, risks and warnings, dividends, insider transactions and financial health.
View the Free AnalysisHave feedback on this article? Concerned about the content? Get in touch with us directly. Alternatively, email editorial-team@simplywallst.com
About XTRA:NXU
Nexus
Develops and sells software solutions for the healthcare market in Germany, Switzerland, Liechtenstein, the Netherlands, Poland, France, Austria, and internationally.
Flawless balance sheet with solid track record.
