Advertisement
- Germany
- /
- Healthcare Services
- /
- XTRA:FRE
Is Fresenius SE KGaA Still Attractively Priced After 43.5% Surge and Strategic Transformation?

Simply Wall St
Reviewed by Bailey Pemberton
- Wondering if Fresenius SE KGaA is truly a bargain or just riding the wave? You're not alone. The stock's value is a hot topic for investors eyeing healthcare giants.
- After soaring 43.5% year-to-date, with a 41.7% gain over the last year, it's clear things are moving. However, the past week has seen a 5.0% pullback, adding a dose of short-term volatility to the mix.
- Recent headlines have revolved around Fresenius advancing its strategic transformation, including portfolio streamlining and a heightened focus on core healthcare operations. This context has boosted optimism about its long-term growth and helped explain the renewed interest from investors.
- When it comes to valuation, Fresenius currently notches a score of 4 out of 6 for being undervalued, which suggests plenty of intriguing signals. We'll dig into how that score was determined using popular valuation approaches, but stick around to discover a potentially even smarter way to size up whether the market has the story right.
Approach 1: Fresenius SE KGaA Discounted Cash Flow (DCF) Analysis
The Discounted Cash Flow (DCF) model is a cornerstone of fundamental valuation, focusing on the company’s future cash flow projections and discounting those back to today’s value. This method aims to estimate what Fresenius SE KGaA is really worth based on its predicted ability to generate cash, not just headline earnings or short-term market sentiment.
For Fresenius SE KGaA, the most recent Free Cash Flow stands at approximately €1.27 billion. Over the next decade, analysts expect this figure to grow steadily, with projections reaching €2.1 billion by 2035. The first five years of growth, based on analyst consensus, show an annual increase. The additional years are extrapolated to reflect ongoing gains. This translates to a strong outlook for cash generation across various business conditions.
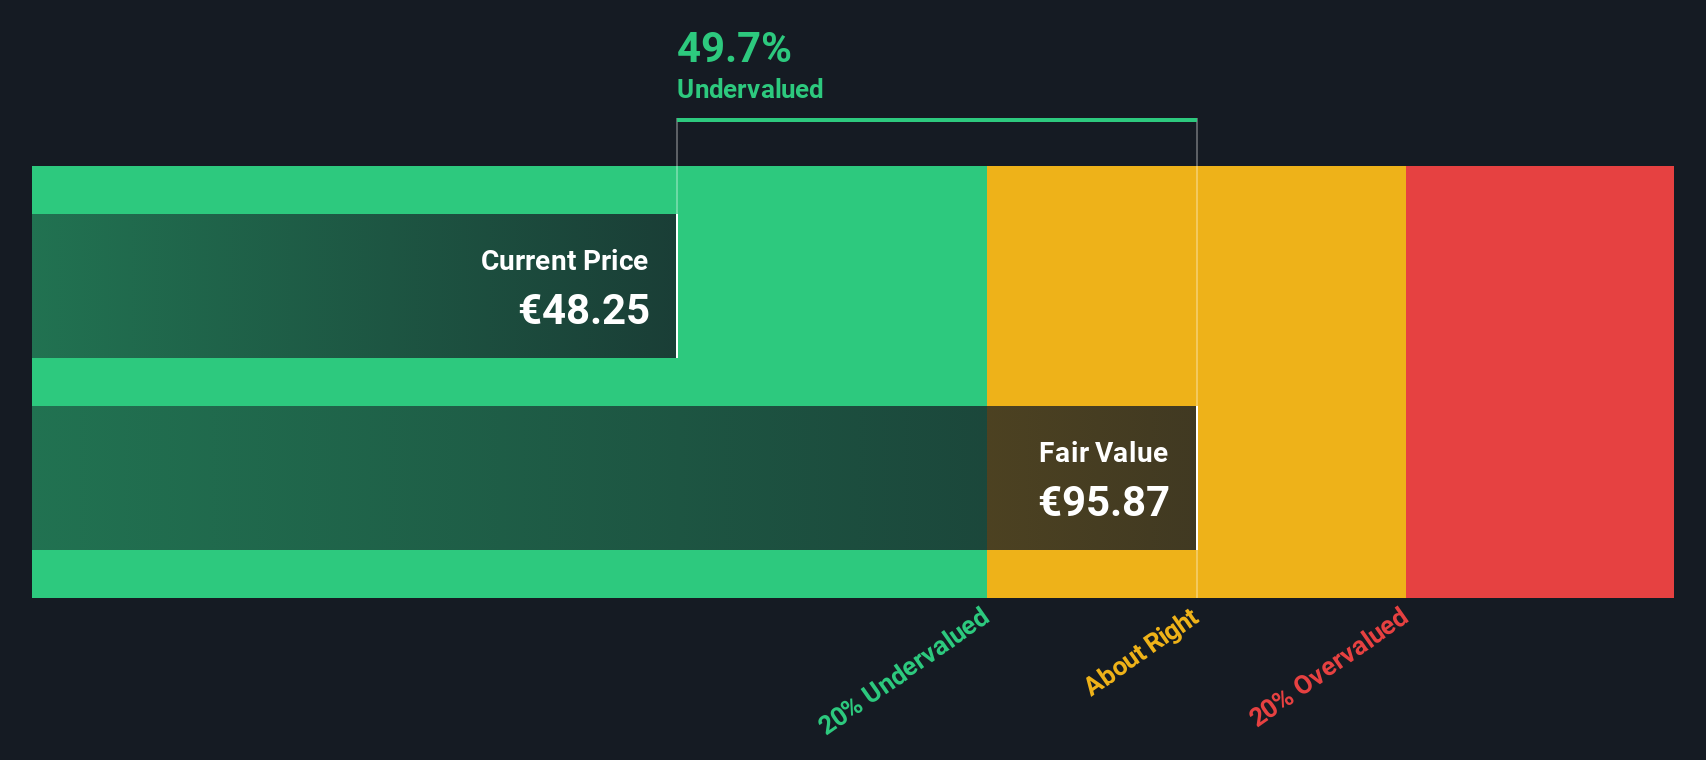
The DCF analysis estimates an intrinsic value of €96.35 per share for Fresenius SE KGaA. Compared to the current market price, this represents a discount of 50.1%, signaling that the stock may be significantly undervalued at its present level.
Result: UNDERVALUED
Our Discounted Cash Flow (DCF) analysis suggests Fresenius SE KGaA is undervalued by 50.1%. Track this in your watchlist or portfolio, or discover 836 more undervalued stocks based on cash flows.
Approach 2: Fresenius SE KGaA Price vs Earnings (PE)
The Price-to-Earnings (PE) ratio is a reliable yardstick for profitable companies like Fresenius SE KGaA, as it benchmarks what investors are willing to pay for a euro of its earnings. This multiple is especially useful because it reflects underlying profitability, which is a key factor for established healthcare businesses with consistent earnings.
Determining what counts as a “normal” or “fair” PE ratio depends on growth expectations and business risk. Fast-growing companies with predictable earnings typically command higher PE multiples, while those facing more uncertainty or slower growth settle for lower ones.
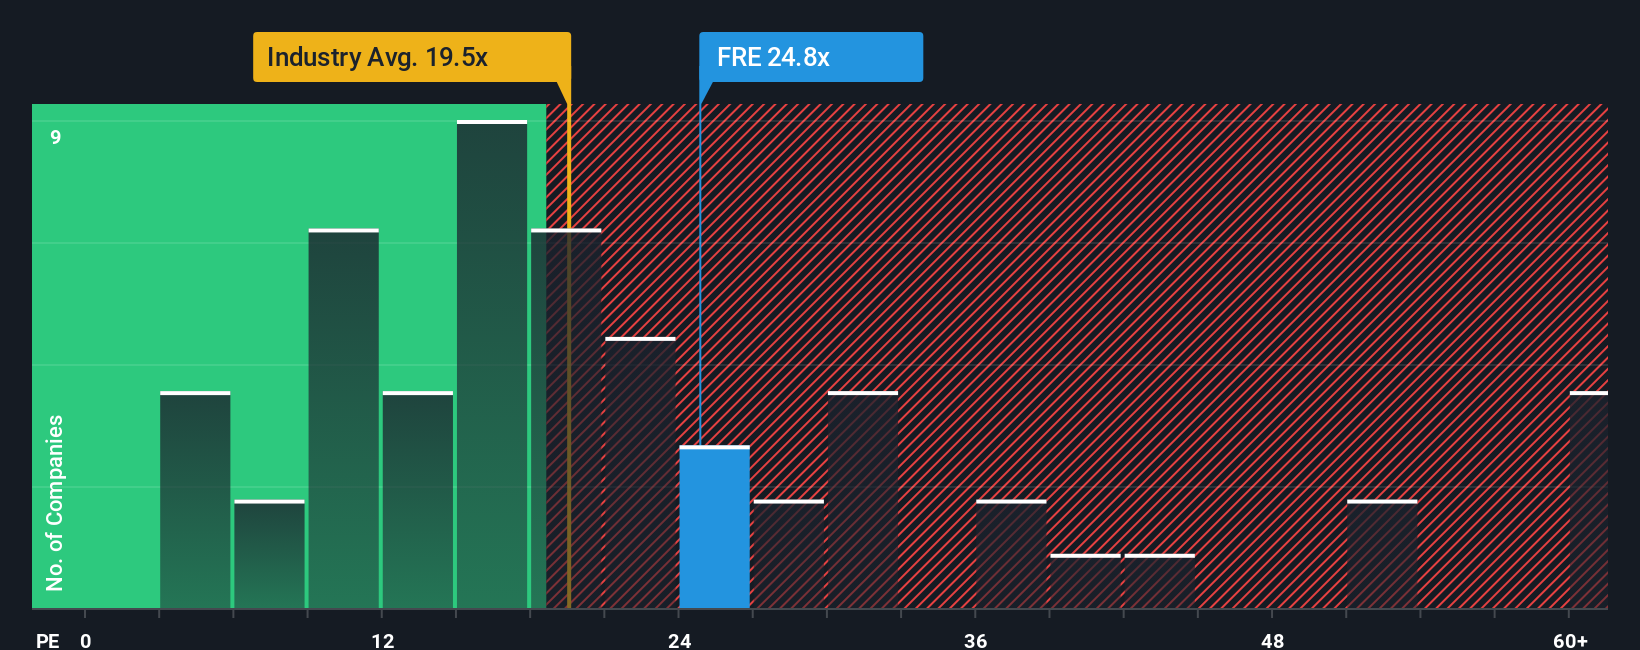
As of now, Fresenius trades at a PE ratio of 25x. This sits above the healthcare industry average of 20.2x but remains below the average among its closest peers at 35.7x. That means investors are willing to pay a modest premium compared to the broader sector, yet not as much as they do for some peer companies.
To cut through the noise, Simply Wall St calculates a proprietary “Fair Ratio” for each stock. For Fresenius, the Fair Ratio is assessed at 33.4x, factoring in the company’s growth outlook, profit margins, industry dynamics, market cap, and risk profile. This approach offers a more balanced benchmark than simply comparing with industry or peer averages, as it is tailored to the company’s specific opportunities and risks.
With Fresenius SE KGaA’s current PE of 25x versus a Fair Ratio of 33.4x, the stock appears to be undervalued from this perspective.
Result: UNDERVALUED
PE ratios tell one story, but what if the real opportunity lies elsewhere? Discover 1402 companies where insiders are betting big on explosive growth.
Upgrade Your Decision Making: Choose your Fresenius SE KGaA Narrative
Earlier, we mentioned that there is an even better way to understand value, so let's introduce you to Narratives. A Narrative is your investment storyline that connects the company’s strategy, opportunities, and risks to a concrete financial forecast and an estimated fair value. This approach makes your view of a stock far more dynamic than relying only on simple ratios or historical numbers.
On Simply Wall St’s Community page, Narratives are accessible tools, trusted by millions of investors, that guide you to build and share your outlook. You set your numbers on future revenue, earnings, margins, and valuation, and link these to your personal thesis about where the business is heading.
This means you can easily see if your story supports buying or selling by comparing your fair value to the current share price. Your narrative automatically updates whenever earnings, company news, or the company’s fundamentals change.
For example, some Fresenius SE KGaA investors believe aggressive restructuring and asset sales will unleash value and quickly restore growth, predicting strong earnings and a fair value 61% above the current price. Others take a more cautious view, projecting modest profit growth and a fair value closer to what analysts expect.
Do you think there's more to the story for Fresenius SE KGaA? Head over to our Community to see what others are saying!

This article by Simply Wall St is general in nature. We provide commentary based on historical data and analyst forecasts only using an unbiased methodology and our articles are not intended to be financial advice. It does not constitute a recommendation to buy or sell any stock, and does not take account of your objectives, or your financial situation. We aim to bring you long-term focused analysis driven by fundamental data. Note that our analysis may not factor in the latest price-sensitive company announcements or qualitative material. Simply Wall St has no position in any stocks mentioned.
New: AI Stock Screener & Alerts
Our new AI Stock Screener scans the market every day to uncover opportunities.
• Dividend Powerhouses (3%+ Yield)
• Undervalued Small Caps with Insider Buying
• High growth Tech and AI Companies
Or build your own from over 50 metrics.
Have feedback on this article? Concerned about the content? Get in touch with us directly. Alternatively, email editorial-team@simplywallst.com
About XTRA:FRE
Fresenius SE KGaA
A health care company, provides products and services for chronically ill patients.
Good value average dividend payer.
Similar Companies
Market Insights

Advertisement
Community Narratives
The company that turned a verb into a global necessity and basically runs the modern internet, digital ads, smartphones, maps, and AI.
Fair Value US$300.00|5.2% undervalued
OS
Community Contributor
Flowers Foods Pays A Fair Price For Health
Fair Value US$16.12|24.9% undervalued
NV
Community Contributor
TMX Group will thrive with 33.3% profit margin and enduring market moat
Fair Value CA$49.90|3.3% overvalued
LI
Community Contributor
The "Molecular Pencil": Why Beam's Technology is Built to Win
Fair Value US$65.01|64.5% undervalued
DA
Community Contributor