
Advertisement
As European markets continue to show resilience, with major indices like the STOXX Europe 600 Index and Germany's DAX posting gains, investors are increasingly exploring diverse opportunities across the continent. Penny stocks, though often considered a relic of past market eras, remain relevant by offering potential growth at lower price points. When these smaller or newer companies are backed by strong financials and solid fundamentals, they present intriguing prospects for those seeking hidden gems in the investment landscape.
Top 10 Penny Stocks In Europe
| Name | Share Price | Market Cap | Rewards & Risks |
| Ariston Holding (BIT:ARIS) | €3.742 | €1.3B | ✅ 5 ⚠️ 2 View Analysis > |
| DigiTouch (BIT:DGT) | €1.99 | €27.5M | ✅ 3 ⚠️ 2 View Analysis > |
| Angler Gaming (NGM:ANGL) | SEK3.60 | SEK269.95M | ✅ 4 ⚠️ 2 View Analysis > |
| Angler Gaming (DB:0QM) | €0.37 | €227.95M | ✅ 2 ⚠️ 2 View Analysis > |
| Hove (CPSE:HOVE) | DKK4.69 | DKK118.83M | ✅ 2 ⚠️ 2 View Analysis > |
| Nurminen Logistics Oyj (HLSE:NLG1V) | €0.95 | €76.66M | ✅ 2 ⚠️ 4 View Analysis > |
| Faes Farma (BME:FAE) | €4.46 | €1.39B | ✅ 4 ⚠️ 1 View Analysis > |
| Deceuninck (ENXTBR:DECB) | €2.045 | €282.66M | ✅ 4 ⚠️ 1 View Analysis > |
| Dovre Group (HLSE:DOV1V) | €0.0794 | €8.39M | ✅ 2 ⚠️ 3 View Analysis > |
| Netgem (ENXTPA:ALNTG) | €0.908 | €30.41M | ✅ 3 ⚠️ 2 View Analysis > |
Click here to see the full list of 275 stocks from our European Penny Stocks screener.
Here we highlight a subset of our preferred stocks from the screener.
AROBS Transilvania Software (BVB:AROBS)
Simply Wall St Financial Health Rating: ★★★★★☆
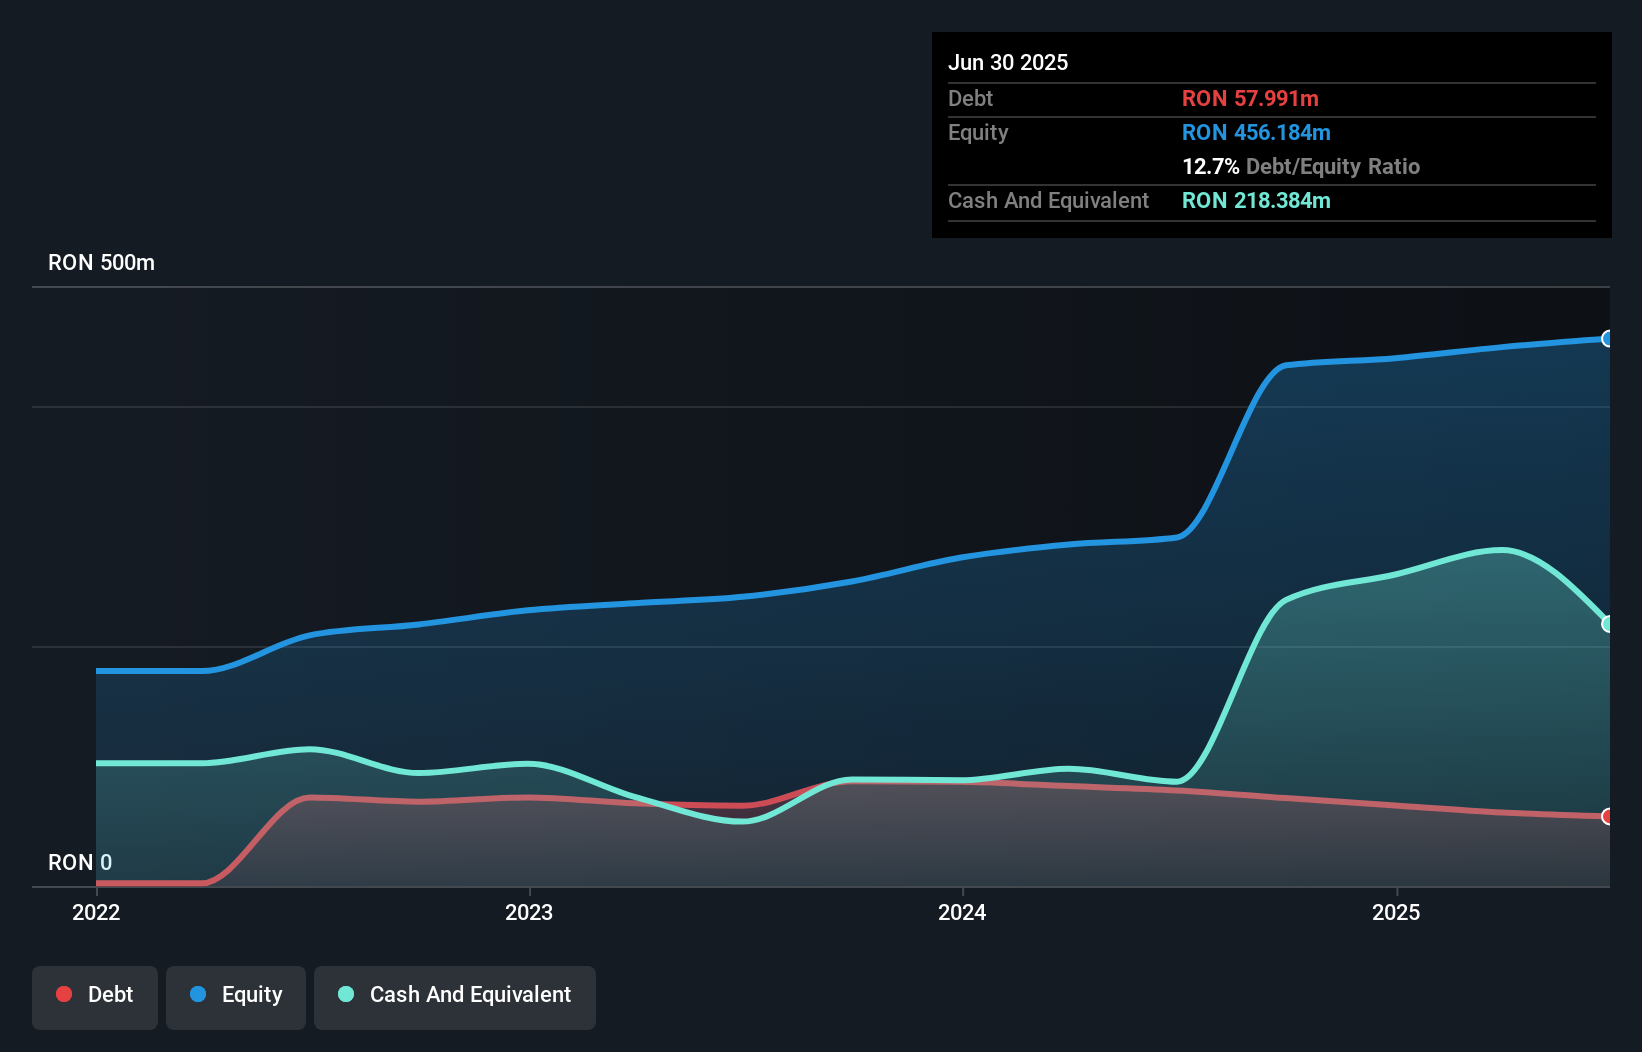
Overview: AROBS Transilvania Software S.A. offers customized software services across Romania, Europe, the United States, Asia, and the Middle East with a market capitalization of RON673.98 million.
Operations: The company generates revenue from three main segments: Software Products (RON88.40 million), Software Services (RON302.50 million), and Integrated Systems (RON32.85 million).
Market Cap: RON673.98M
AROBS Transilvania Software S.A. demonstrates a mixed financial profile with revenues of RON215.35 million for the first half of 2025, showing growth from the previous year. The company maintains a healthy balance sheet, with more cash than total debt and short-term assets exceeding liabilities. Its earnings are forecasted to grow annually by 29.13%, although historical earnings have declined significantly over five years. Trading below estimated fair value, AROBS's return on equity remains low at 4.5%. Notably, its recent profit growth outpaces industry averages, supported by stable weekly volatility and high-quality earnings without significant shareholder dilution recently.
- Unlock comprehensive insights into our analysis of AROBS Transilvania Software stock in this financial health report.
- Assess AROBS Transilvania Software's future earnings estimates with our detailed growth reports.
Glaston Oyj Abp (HLSE:GLA1V)
Simply Wall St Financial Health Rating: ★★★★☆☆
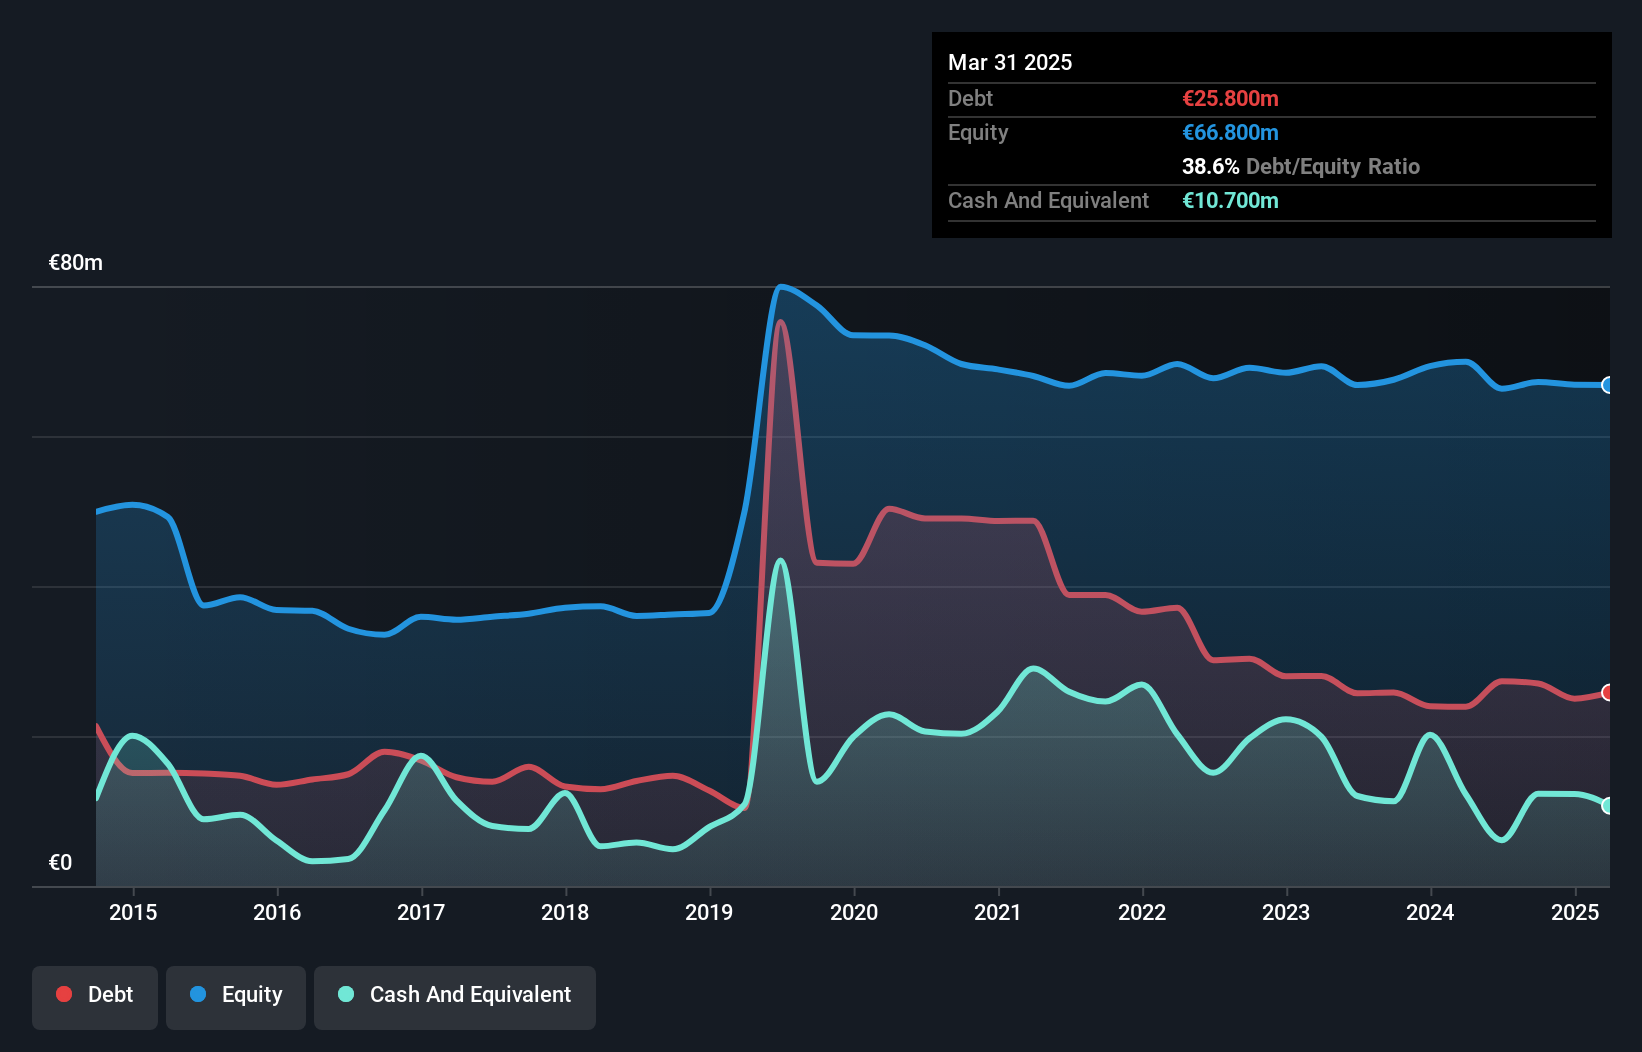
Overview: Glaston Oyj Abp manufactures and sells glass processing machines across various regions including Finland, Europe, the Middle East, Africa, the Americas, China, and the rest of Asia Pacific with a market cap of €47.93 million.
Operations: The company generates revenue from two main segments: Architecture, contributing €167.96 million, and Mobility, Display & Solar, which accounts for €47.42 million.
Market Cap: €47.93M
Glaston Oyj Abp presents a complex picture for investors, with a market cap of €47.93 million and operations spanning multiple regions. Despite being unprofitable, the company has reduced losses over five years and maintains a satisfactory net debt to equity ratio of 29.9%. However, its short-term assets (€72.8M) fall short of covering liabilities (€80.7M). Recent earnings showed a net loss for Q2 2025 despite slight sales growth to €51.8 million from the previous year. Trading significantly below estimated fair value, Glaston offers an attractive dividend yield of 9.65% but faces challenges with inexperienced management tenure averaging just 0.4 years.
- Click here and access our complete financial health analysis report to understand the dynamics of Glaston Oyj Abp.
- Learn about Glaston Oyj Abp's future growth trajectory here.
bet-at-home.com (XTRA:ACX)
Simply Wall St Financial Health Rating: ★★★★★★
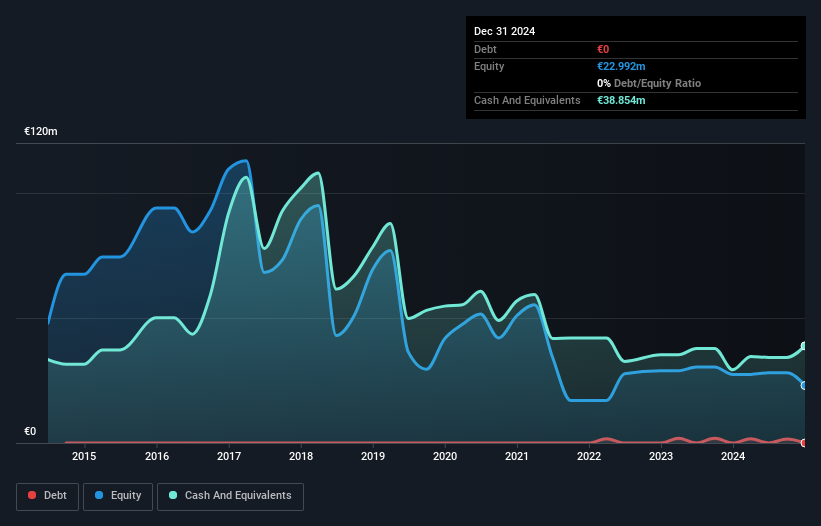
Overview: bet-at-home.com AG, with a market cap of €18.74 million, operates through its subsidiaries to offer online sports betting and casino services across Germany, Austria, Eastern Europe, and the rest of Western Europe.
Operations: The company's revenue is primarily derived from two segments: Online Sports Bets, generating €45.46 million, and Online Gaming, which includes Casino, Poker, Games, and Virtual Sports activities, contributing €6.37 million.
Market Cap: €18.74M
bet-at-home.com AG operates with a market cap of €18.74 million, showing resilience despite being unprofitable and experiencing increased losses over the past five years. The company is debt-free, with short-term assets of €42.8 million comfortably covering both short-term (€26.6M) and long-term liabilities (€1M). Recent earnings for the half year ended June 30, 2025, indicate stable sales at €25.34 million and improved net income to €1.8 million from last year's €0.649 million, reflecting better operational efficiency despite challenges in profitability and negative return on equity (-13.3%).
- Click here to discover the nuances of bet-at-home.com with our detailed analytical financial health report.
- Evaluate bet-at-home.com's prospects by accessing our earnings growth report.
Taking Advantage
- Unlock our comprehensive list of 275 European Penny Stocks by clicking here.
- Seeking Other Investments? The end of cancer? These 27 emerging AI stocks are developing tech that will allow early idenification of life changing disesaes like cancer and Alzheimer's.
This article by Simply Wall St is general in nature. We provide commentary based on historical data and analyst forecasts only using an unbiased methodology and our articles are not intended to be financial advice. It does not constitute a recommendation to buy or sell any stock, and does not take account of your objectives, or your financial situation. We aim to bring you long-term focused analysis driven by fundamental data. Note that our analysis may not factor in the latest price-sensitive company announcements or qualitative material. Simply Wall St has no position in any stocks mentioned.
New: Manage All Your Stock Portfolios in One Place
We've created the ultimate portfolio companion for stock investors, and it's free.
• Connect an unlimited number of Portfolios and see your total in one currency
• Be alerted to new Warning Signs or Risks via email or mobile
• Track the Fair Value of your stocks
Have feedback on this article? Concerned about the content? Get in touch with us directly. Alternatively, email editorial-team@simplywallst.com
About HLSE:GLA1V
Glaston Oyj Abp
Manufactures and sells glass processing machines in Finland, Europe, the Middle East, Africa, the Americas, China, and rest of Asia Pacific.
Undervalued established dividend payer.
Market Insights

Advertisement
Community Narratives
The company that turned a verb into a global necessity and basically runs the modern internet, digital ads, smartphones, maps, and AI.
Fair Value US$300.00|10.8% undervalued
OS
Community Contributor
Flowers Foods Pays A Fair Price For Health
Fair Value US$16.12|22.0% undervalued
NV
Community Contributor
TMX Group will thrive with 33.3% profit margin and enduring market moat
Fair Value CA$49.90|3.8% overvalued
LI
Community Contributor