
Advertisement
These 4 Measures Indicate That PUMA (ETR:PUM) Is Using Debt Reasonably Well
David Iben put it well when he said, 'Volatility is not a risk we care about. What we care about is avoiding the permanent loss of capital.' When we think about how risky a company is, we always like to look at its use of debt, since debt overload can lead to ruin. We note that PUMA SE (ETR:PUM) does have debt on its balance sheet. But the real question is whether this debt is making the company risky.
Why Does Debt Bring Risk?
Debt assists a business until the business has trouble paying it off, either with new capital or with free cash flow. Ultimately, if the company can't fulfill its legal obligations to repay debt, shareholders could walk away with nothing. However, a more frequent (but still costly) occurrence is where a company must issue shares at bargain-basement prices, permanently diluting shareholders, just to shore up its balance sheet. Having said that, the most common situation is where a company manages its debt reasonably well - and to its own advantage. The first step when considering a company's debt levels is to consider its cash and debt together.
Check out our latest analysis for PUMA
How Much Debt Does PUMA Carry?
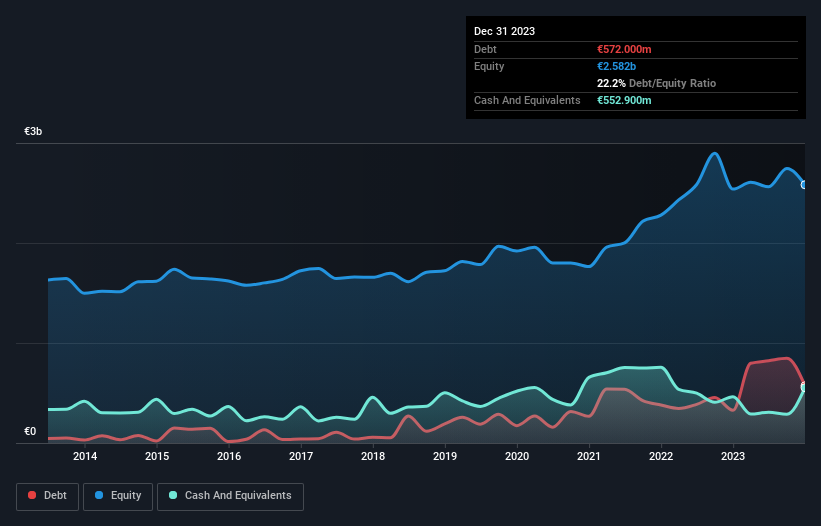
The image below, which you can click on for greater detail, shows that at December 2023 PUMA had debt of €572.0m, up from €327.4m in one year. However, it also had €552.9m in cash, and so its net debt is €19.1m.
How Healthy Is PUMA's Balance Sheet?
The latest balance sheet data shows that PUMA had liabilities of €2.54b due within a year, and liabilities of €1.52b falling due after that. Offsetting these obligations, it had cash of €552.9m as well as receivables valued at €1.40b due within 12 months. So its liabilities outweigh the sum of its cash and (near-term) receivables by €2.11b.
PUMA has a market capitalization of €6.78b, so it could very likely raise cash to ameliorate its balance sheet, if the need arose. But it's clear that we should definitely closely examine whether it can manage its debt without dilution. Carrying virtually no net debt, PUMA has a very light debt load indeed.
We use two main ratios to inform us about debt levels relative to earnings. The first is net debt divided by earnings before interest, tax, depreciation, and amortization (EBITDA), while the second is how many times its earnings before interest and tax (EBIT) covers its interest expense (or its interest cover, for short). The advantage of this approach is that we take into account both the absolute quantum of debt (with net debt to EBITDA) and the actual interest expenses associated with that debt (with its interest cover ratio).
With debt at a measly 0.025 times EBITDA and EBIT covering interest a whopping 13.5 times, it's clear that PUMA is not a desperate borrower. Indeed relative to its earnings its debt load seems light as a feather. But the other side of the story is that PUMA saw its EBIT decline by 4.3% over the last year. That sort of decline, if sustained, will obviously make debt harder to handle. There's no doubt that we learn most about debt from the balance sheet. But ultimately the future profitability of the business will decide if PUMA can strengthen its balance sheet over time. So if you're focused on the future you can check out this free report showing analyst profit forecasts.
Finally, a company can only pay off debt with cold hard cash, not accounting profits. So the logical step is to look at the proportion of that EBIT that is matched by actual free cash flow. In the last three years, PUMA's free cash flow amounted to 42% of its EBIT, less than we'd expect. That's not great, when it comes to paying down debt.
Our View
PUMA's interest cover was a real positive on this analysis, as was its net debt to EBITDA. Having said that, its EBIT growth rate somewhat sensitizes us to potential future risks to the balance sheet. When we consider all the elements mentioned above, it seems to us that PUMA is managing its debt quite well. Having said that, the load is sufficiently heavy that we would recommend any shareholders keep a close eye on it. When analysing debt levels, the balance sheet is the obvious place to start. However, not all investment risk resides within the balance sheet - far from it. We've identified 1 warning sign with PUMA , and understanding them should be part of your investment process.
If you're interested in investing in businesses that can grow profits without the burden of debt, then check out this free list of growing businesses that have net cash on the balance sheet.
New: Manage All Your Stock Portfolios in One Place
We've created the ultimate portfolio companion for stock investors, and it's free.
• Connect an unlimited number of Portfolios and see your total in one currency
• Be alerted to new Warning Signs or Risks via email or mobile
• Track the Fair Value of your stocks
Have feedback on this article? Concerned about the content? Get in touch with us directly. Alternatively, email editorial-team (at) simplywallst.com.
This article by Simply Wall St is general in nature. We provide commentary based on historical data and analyst forecasts only using an unbiased methodology and our articles are not intended to be financial advice. It does not constitute a recommendation to buy or sell any stock, and does not take account of your objectives, or your financial situation. We aim to bring you long-term focused analysis driven by fundamental data. Note that our analysis may not factor in the latest price-sensitive company announcements or qualitative material. Simply Wall St has no position in any stocks mentioned.
About XTRA:PUM
PUMA
Engages in the development and sale of sports and sports lifestyle products in Germany, rest of Europe, the United States, North America, and internationally.
Undervalued with moderate growth potential.
Similar Companies
Market Insights

Advertisement
Community Narratives
MicroVision will explode future revenue by 380.37% with a vision towards success
Fair Value US$60|98.4% undervalued
TH
Community Contributor
The Indispensable Artery for a New North American Economy
Fair Value CA$132.87|1.6% undervalued
TI
Community Contributor
Recently Updated Narratives
BE


Bejgal on MINISO Group Holding ·
MINISO's fair value is projected at 26.69 with an anticipated PE ratio shift of 20x
Fair Value:US$26.6928.0% undervalued
44 followersusers have followed this narrative
3 commentsusers have commented on this narrative
0 likesusers have liked this narrative
TI


TickerTickle on Oracle ·
The Quiet Giant That Became AI’s Power Grid
Fair Value:US$389.8149.5% undervalued
7 followersusers have followed this narrative
0 commentsusers have commented on this narrative
0 likesusers have liked this narrative
AU

AuCA on Nova Ljubljanska Banka d.d ·
Nova Ljubljanska Banka d.d will expect a 11.2% revenue boost driving future growth
Fair Value:€20916.3% undervalued
23 followersusers have followed this narrative
3 commentsusers have commented on this narrative
0 likesusers have liked this narrative
Popular Narratives
OS


oscargarcia on Alphabet ·
The company that turned a verb into a global necessity and basically runs the modern internet, digital ads, smartphones, maps, and AI.
Fair Value:US$3404.9% undervalued
134 followersusers have followed this narrative
6 commentsusers have commented on this narrative
18 likesusers have liked this narrative
TH

TheWallstreetKing on MicroVision ·
MicroVision will explode future revenue by 380.37% with a vision towards success
Fair Value:US$6098.4% undervalued
83 followersusers have followed this narrative
10 commentsusers have commented on this narrative
18 likesusers have liked this narrative
AN


AnalystConsensusTarget on NVIDIA ·
NVDA: Expanding AI Demand Will Drive Major Data Center Investments Through 2026
Fair Value:US$232.7923.6% undervalued
920 followersusers have followed this narrative
5 commentsusers have commented on this narrative
21 likesusers have liked this narrative