Stock Analysis
Great week for PUMA SE (ETR:PUM) institutional investors after losing 23% over the previous year


Key Insights
- Given the large stake in the stock by institutions, PUMA's stock price might be vulnerable to their trading decisions
- A total of 7 investors have a majority stake in the company with 52% ownership
- Ownership research along with analyst forecasts data help provide a good understanding of opportunities in a stock
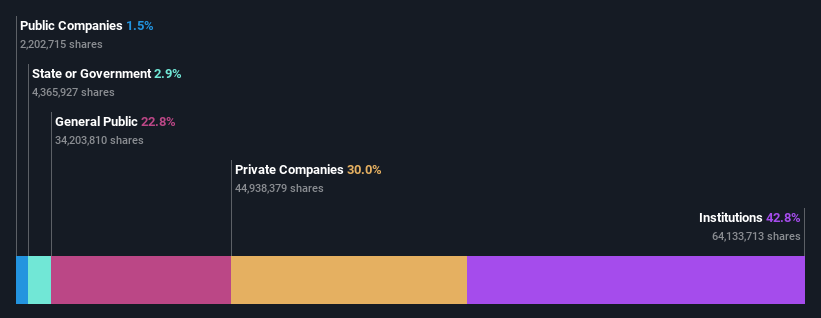
Every investor in PUMA SE (ETR:PUM) should be aware of the most powerful shareholder groups. With 43% stake, institutions possess the maximum shares in the company. In other words, the group stands to gain the most (or lose the most) from their investment into the company.
Institutional investors would appreciate the 5.0% increase in share price last week, given their one-year losses have totalled a disappointing 23%.
In the chart below, we zoom in on the different ownership groups of PUMA.
Check out our latest analysis for PUMA
What Does The Institutional Ownership Tell Us About PUMA?
Many institutions measure their performance against an index that approximates the local market. So they usually pay more attention to companies that are included in major indices.
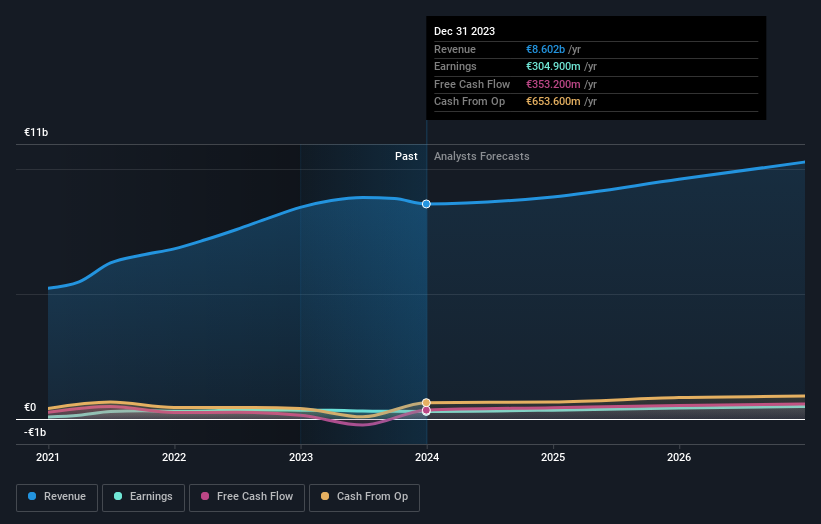
PUMA already has institutions on the share registry. Indeed, they own a respectable stake in the company. This suggests some credibility amongst professional investors. But we can't rely on that fact alone since institutions make bad investments sometimes, just like everyone does. If multiple institutions change their view on a stock at the same time, you could see the share price drop fast. It's therefore worth looking at PUMA's earnings history below. Of course, the future is what really matters.
PUMA is not owned by hedge funds. Our data shows that Financière Pinault SCA is the largest shareholder with 30% of shares outstanding. With 5.1% and 4.5% of the shares outstanding respectively, T. Rowe Price Group, Inc. and BlackRock, Inc. are the second and third largest shareholders.
We also observed that the top 7 shareholders account for more than half of the share register, with a few smaller shareholders to balance the interests of the larger ones to a certain extent.
While it makes sense to study institutional ownership data for a company, it also makes sense to study analyst sentiments to know which way the wind is blowing. There are plenty of analysts covering the stock, so it might be worth seeing what they are forecasting, too.
Insider Ownership Of PUMA
While the precise definition of an insider can be subjective, almost everyone considers board members to be insiders. Company management run the business, but the CEO will answer to the board, even if he or she is a member of it.
Most consider insider ownership a positive because it can indicate the board is well aligned with other shareholders. However, on some occasions too much power is concentrated within this group.
We note our data does not show any board members holding shares, personally. It is unusual not to have at least some personal holdings by board members, so our data might be flawed. A good next step would be to check how much the CEO is paid.
General Public Ownership
With a 23% ownership, the general public, mostly comprising of individual investors, have some degree of sway over PUMA. While this group can't necessarily call the shots, it can certainly have a real influence on how the company is run.
Private Company Ownership
Our data indicates that Private Companies hold 30%, of the company's shares. It might be worth looking deeper into this. If related parties, such as insiders, have an interest in one of these private companies, that should be disclosed in the annual report. Private companies may also have a strategic interest in the company.
Next Steps:
I find it very interesting to look at who exactly owns a company. But to truly gain insight, we need to consider other information, too. To that end, you should be aware of the 1 warning sign we've spotted with PUMA .
But ultimately it is the future, not the past, that will determine how well the owners of this business will do. Therefore we think it advisable to take a look at this free report showing whether analysts are predicting a brighter future.
NB: Figures in this article are calculated using data from the last twelve months, which refer to the 12-month period ending on the last date of the month the financial statement is dated. This may not be consistent with full year annual report figures.
Valuation is complex, but we're helping make it simple.
Find out whether PUMA is potentially over or undervalued by checking out our comprehensive analysis, which includes fair value estimates, risks and warnings, dividends, insider transactions and financial health.
View the Free AnalysisHave feedback on this article? Concerned about the content? Get in touch with us directly. Alternatively, email editorial-team (at) simplywallst.com.
This article by Simply Wall St is general in nature. We provide commentary based on historical data and analyst forecasts only using an unbiased methodology and our articles are not intended to be financial advice. It does not constitute a recommendation to buy or sell any stock, and does not take account of your objectives, or your financial situation. We aim to bring you long-term focused analysis driven by fundamental data. Note that our analysis may not factor in the latest price-sensitive company announcements or qualitative material. Simply Wall St has no position in any stocks mentioned.
About XTRA:PUM
PUMA
PUMA SE, together with its subsidiaries, engages in the development and sale of athletic footwear, apparel, and accessories in Europe, the Middle East, Africa, the Americas, and the Asia Pacific.
Excellent balance sheet average dividend payer.
