
Advertisement

Legendary fund manager Li Lu (who Charlie Munger backed) once said, 'The biggest investment risk is not the volatility of prices, but whether you will suffer a permanent loss of capital.' It's only natural to consider a company's balance sheet when you examine how risky it is, since debt is often involved when a business collapses. As with many other companies STS Group AG (ETR:SF3) makes use of debt. But is this debt a concern to shareholders?
What Risk Does Debt Bring?
Debt is a tool to help businesses grow, but if a business is incapable of paying off its lenders, then it exists at their mercy. In the worst case scenario, a company can go bankrupt if it cannot pay its creditors. However, a more common (but still painful) scenario is that it has to raise new equity capital at a low price, thus permanently diluting shareholders. Of course, plenty of companies use debt to fund growth, without any negative consequences. When we examine debt levels, we first consider both cash and debt levels, together.
See our latest analysis for STS Group
What Is STS Group's Debt?
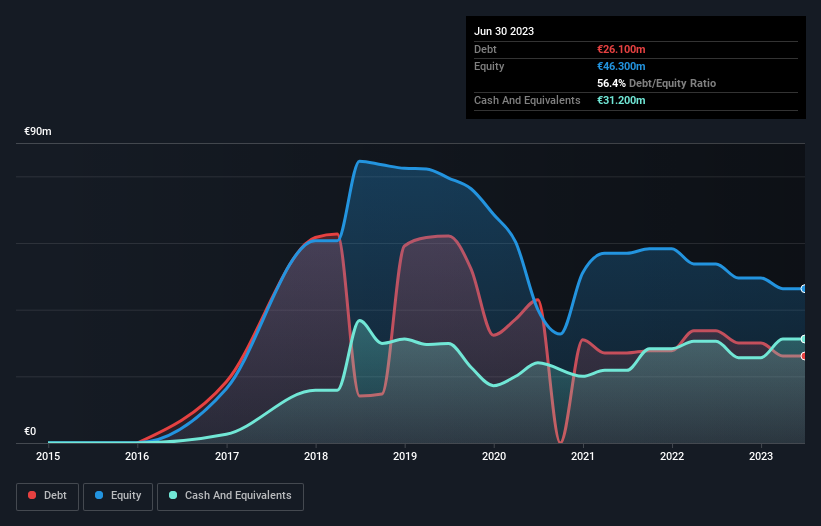
The image below, which you can click on for greater detail, shows that STS Group had debt of €26.1m at the end of June 2023, a reduction from €33.7m over a year. However, it does have €31.2m in cash offsetting this, leading to net cash of €5.10m.
How Strong Is STS Group's Balance Sheet?
According to the last reported balance sheet, STS Group had liabilities of €129.6m due within 12 months, and liabilities of €55.2m due beyond 12 months. On the other hand, it had cash of €31.2m and €52.5m worth of receivables due within a year. So its liabilities outweigh the sum of its cash and (near-term) receivables by €101.1m.
This deficit casts a shadow over the €31.7m company, like a colossus towering over mere mortals. So we'd watch its balance sheet closely, without a doubt. After all, STS Group would likely require a major re-capitalisation if it had to pay its creditors today. Given that STS Group has more cash than debt, we're pretty confident it can handle its debt, despite the fact that it has a lot of liabilities in total.
Notably, STS Group made a loss at the EBIT level, last year, but improved that to positive EBIT of €500k in the last twelve months. There's no doubt that we learn most about debt from the balance sheet. But it is future earnings, more than anything, that will determine STS Group's ability to maintain a healthy balance sheet going forward. So if you want to see what the professionals think, you might find this free report on analyst profit forecasts to be interesting.
Finally, while the tax-man may adore accounting profits, lenders only accept cold hard cash. While STS Group has net cash on its balance sheet, it's still worth taking a look at its ability to convert earnings before interest and tax (EBIT) to free cash flow, to help us understand how quickly it is building (or eroding) that cash balance. Over the last year, STS Group actually produced more free cash flow than EBIT. There's nothing better than incoming cash when it comes to staying in your lenders' good graces.
Summing Up
While STS Group does have more liabilities than liquid assets, it also has net cash of €5.10m. And it impressed us with free cash flow of €12m, being 2,480% of its EBIT. Despite its cash we think that STS Group seems to struggle to handle its total liabilities, so we are wary of the stock. When analysing debt levels, the balance sheet is the obvious place to start. However, not all investment risk resides within the balance sheet - far from it. Be aware that STS Group is showing 1 warning sign in our investment analysis , you should know about...
If, after all that, you're more interested in a fast growing company with a rock-solid balance sheet, then check out our list of net cash growth stocks without delay.
New: Manage All Your Stock Portfolios in One Place
We've created the ultimate portfolio companion for stock investors, and it's free.
• Connect an unlimited number of Portfolios and see your total in one currency
• Be alerted to new Warning Signs or Risks via email or mobile
• Track the Fair Value of your stocks
Have feedback on this article? Concerned about the content? Get in touch with us directly. Alternatively, email editorial-team (at) simplywallst.com.
This article by Simply Wall St is general in nature. We provide commentary based on historical data and analyst forecasts only using an unbiased methodology and our articles are not intended to be financial advice. It does not constitute a recommendation to buy or sell any stock, and does not take account of your objectives, or your financial situation. We aim to bring you long-term focused analysis driven by fundamental data. Note that our analysis may not factor in the latest price-sensitive company announcements or qualitative material. Simply Wall St has no position in any stocks mentioned.
About XTRA:SF3
STS Group
Supplies components and systems for the commercial vehicle and automotive industry in Germany, France, Mexico, the United States, and China.
Undervalued with moderate growth potential.
Similar Companies
Market Insights


Advertisement
Community Narratives
Alphabet: The Under-appreciated Compounder Hiding in Plain Sight
Fair Value US$282.83|31.8% undervalued
BL
Community Contributor
Planet Labs: At The Heart Of The Emerging New Space Boom
Fair Value US$11.31|44.7% undervalued
AN
Community Contributor
Exxon in Guyana 5 year forecast Low $135 to High $189
Fair Value US$189.00|40.9% undervalued
AG
Community Contributor