
Advertisement
Howard Marks put it nicely when he said that, rather than worrying about share price volatility, 'The possibility of permanent loss is the risk I worry about... and every practical investor I know worries about.' It's only natural to consider a company's balance sheet when you examine how risky it is, since debt is often involved when a business collapses. We can see that SAF-Holland SE (ETR:SFQ) does use debt in its business. But the real question is whether this debt is making the company risky.
What Risk Does Debt Bring?
Debt is a tool to help businesses grow, but if a business is incapable of paying off its lenders, then it exists at their mercy. In the worst case scenario, a company can go bankrupt if it cannot pay its creditors. While that is not too common, we often do see indebted companies permanently diluting shareholders because lenders force them to raise capital at a distressed price. Of course, plenty of companies use debt to fund growth, without any negative consequences. When we think about a company's use of debt, we first look at cash and debt together.
View our latest analysis for SAF-Holland
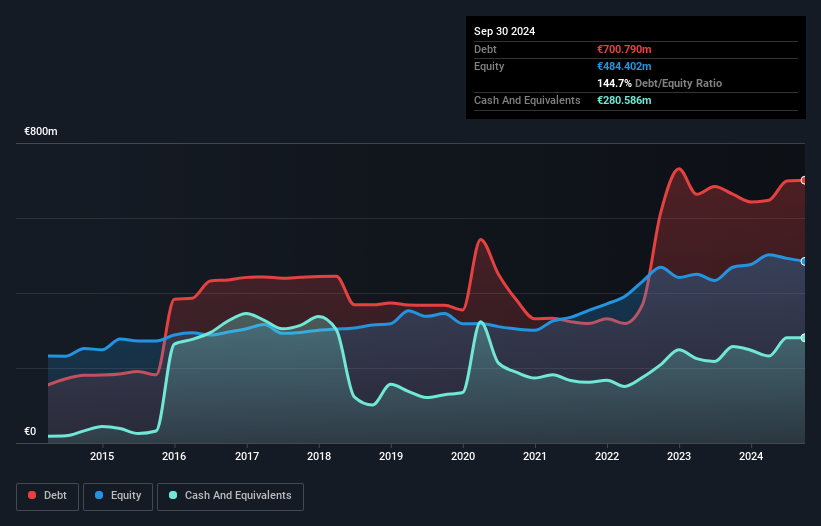
What Is SAF-Holland's Debt?
You can click the graphic below for the historical numbers, but it shows that as of September 2024 SAF-Holland had €700.8m of debt, an increase on €663.6m, over one year. However, it does have €280.6m in cash offsetting this, leading to net debt of about €420.2m.
How Healthy Is SAF-Holland's Balance Sheet?
The latest balance sheet data shows that SAF-Holland had liabilities of €380.6m due within a year, and liabilities of €813.8m falling due after that. Offsetting this, it had €280.6m in cash and €230.8m in receivables that were due within 12 months. So its liabilities outweigh the sum of its cash and (near-term) receivables by €683.0m.
This deficit is considerable relative to its market capitalization of €741.7m, so it does suggest shareholders should keep an eye on SAF-Holland's use of debt. Should its lenders demand that it shore up the balance sheet, shareholders would likely face severe dilution.
In order to size up a company's debt relative to its earnings, we calculate its net debt divided by its earnings before interest, tax, depreciation, and amortization (EBITDA) and its earnings before interest and tax (EBIT) divided by its interest expense (its interest cover). Thus we consider debt relative to earnings both with and without depreciation and amortization expenses.
SAF-Holland's net debt is sitting at a very reasonable 1.7 times its EBITDA, while its EBIT covered its interest expense just 4.0 times last year. While these numbers do not alarm us, it's worth noting that the cost of the company's debt is having a real impact. If SAF-Holland can keep growing EBIT at last year's rate of 14% over the last year, then it will find its debt load easier to manage. When analysing debt levels, the balance sheet is the obvious place to start. But ultimately the future profitability of the business will decide if SAF-Holland can strengthen its balance sheet over time. So if you want to see what the professionals think, you might find this free report on analyst profit forecasts to be interesting.
Finally, while the tax-man may adore accounting profits, lenders only accept cold hard cash. So we always check how much of that EBIT is translated into free cash flow. During the last three years, SAF-Holland produced sturdy free cash flow equating to 79% of its EBIT, about what we'd expect. This free cash flow puts the company in a good position to pay down debt, when appropriate.
Our View
When it comes to the balance sheet, the standout positive for SAF-Holland was the fact that it seems able to convert EBIT to free cash flow confidently. But the other factors we noted above weren't so encouraging. For instance it seems like it has to struggle a bit to handle its total liabilities. When we consider all the factors mentioned above, we do feel a bit cautious about SAF-Holland's use of debt. While we appreciate debt can enhance returns on equity, we'd suggest that shareholders keep close watch on its debt levels, lest they increase. There's no doubt that we learn most about debt from the balance sheet. However, not all investment risk resides within the balance sheet - far from it. For instance, we've identified 2 warning signs for SAF-Holland that you should be aware of.
At the end of the day, it's often better to focus on companies that are free from net debt. You can access our special list of such companies (all with a track record of profit growth). It's free.
New: Manage All Your Stock Portfolios in One Place
We've created the ultimate portfolio companion for stock investors, and it's free.
• Connect an unlimited number of Portfolios and see your total in one currency
• Be alerted to new Warning Signs or Risks via email or mobile
• Track the Fair Value of your stocks
Have feedback on this article? Concerned about the content? Get in touch with us directly. Alternatively, email editorial-team (at) simplywallst.com.
This article by Simply Wall St is general in nature. We provide commentary based on historical data and analyst forecasts only using an unbiased methodology and our articles are not intended to be financial advice. It does not constitute a recommendation to buy or sell any stock, and does not take account of your objectives, or your financial situation. We aim to bring you long-term focused analysis driven by fundamental data. Note that our analysis may not factor in the latest price-sensitive company announcements or qualitative material. Simply Wall St has no position in any stocks mentioned.
About XTRA:SFQ
SAF-Holland
Manufactures and sells chassis-related assemblies and components for trailers, trucks, semi-trailers, and buses.
Established dividend payer with adequate balance sheet.
Similar Companies
Market Insights

Advertisement
Community Narratives
Finding The True Value Of A Logistics Powerhouse
Fair Value US$95.21|8.4% undervalued
NV
Community Contributor
Paradigm Biopharmaceuticals Will Lead Osteoarthritis Treatment with Zilosul's FDA Success
Fair Value AU$5.50|92.1% undervalued
AM
Community Contributor
Barrick Mining (ABX:CA): A Gold Hedge against a U.S. Shutdown
Fair Value CA$60.00|24.2% undervalued
GM
Community Contributor