Stock Analysis
- Czech Republic
- /
- Electric Utilities
- /
- SEP:CEZ
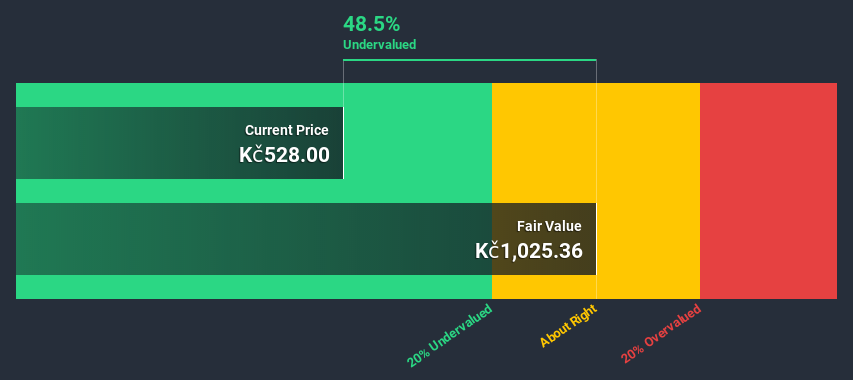
CEZ, a. s. (SEP:CEZ) Shares Could Be 49% Below Their Intrinsic Value Estimate


Does the March share price for CEZ, a. s. (SEP:CEZ) reflect what it's really worth? Today, we will estimate the stock's intrinsic value by taking the expected future cash flows and discounting them to their present value. One way to achieve this is by employing the Discounted Cash Flow (DCF) model. Models like these may appear beyond the comprehension of a lay person, but they're fairly easy to follow.
Companies can be valued in a lot of ways, so we would point out that a DCF is not perfect for every situation. If you still have some burning questions about this type of valuation, take a look at the Simply Wall St analysis model.
View our latest analysis for CEZ a. s
What's the estimated valuation?
We're using the 2-stage growth model, which simply means we take in account two stages of company's growth. In the initial period the company may have a higher growth rate and the second stage is usually assumed to have a stable growth rate. To begin with, we have to get estimates of the next ten years of cash flows. Where possible we use analyst estimates, but when these aren't available we extrapolate the previous free cash flow (FCF) from the last estimate or reported value. We assume companies with shrinking free cash flow will slow their rate of shrinkage, and that companies with growing free cash flow will see their growth rate slow, over this period. We do this to reflect that growth tends to slow more in the early years than it does in later years.
Generally we assume that a dollar today is more valuable than a dollar in the future, so we need to discount the sum of these future cash flows to arrive at a present value estimate:
10-year free cash flow (FCF) estimate
| 2021 | 2022 | 2023 | 2024 | 2025 | 2026 | 2027 | 2028 | 2029 | 2030 | |
| Levered FCF (CZK, Millions) | Kč38.0b | Kč22.6b | Kč24.8b | Kč25.1b | Kč26.4b | Kč27.4b | Kč28.2b | Kč28.9b | Kč29.5b | Kč30.1b |
| Growth Rate Estimate Source | Analyst x6 | Analyst x6 | Analyst x4 | Analyst x3 | Analyst x3 | Est @ 3.7% | Est @ 2.96% | Est @ 2.43% | Est @ 2.07% | Est @ 1.82% |
| Present Value (CZK, Millions) Discounted @ 6.1% | Kč35.8k | Kč20.0k | Kč20.7k | Kč19.8k | Kč19.7k | Kč19.2k | Kč18.6k | Kč18.0k | Kč17.3k | Kč16.6k |
("Est" = FCF growth rate estimated by Simply Wall St)
Present Value of 10-year Cash Flow (PVCF) = Kč206b
We now need to calculate the Terminal Value, which accounts for all the future cash flows after this ten year period. The Gordon Growth formula is used to calculate Terminal Value at a future annual growth rate equal to the 5-year average of the 10-year government bond yield of 1.2%. We discount the terminal cash flows to today's value at a cost of equity of 6.1%.
Terminal Value (TV)= FCF2030 × (1 + g) ÷ (r – g) = Kč30b× (1 + 1.2%) ÷ (6.1%– 1.2%) = Kč621b
Present Value of Terminal Value (PVTV)= TV / (1 + r)10= Kč621b÷ ( 1 + 6.1%)10= Kč343b
The total value is the sum of cash flows for the next ten years plus the discounted terminal value, which results in the Total Equity Value, which in this case is Kč549b. In the final step we divide the equity value by the number of shares outstanding. Compared to the current share price of Kč528, the company appears quite good value at a 49% discount to where the stock price trades currently. Valuations are imprecise instruments though, rather like a telescope - move a few degrees and end up in a different galaxy. Do keep this in mind.
Important assumptions
We would point out that the most important inputs to a discounted cash flow are the discount rate and of course the actual cash flows. Part of investing is coming up with your own evaluation of a company's future performance, so try the calculation yourself and check your own assumptions. The DCF also does not consider the possible cyclicality of an industry, or a company's future capital requirements, so it does not give a full picture of a company's potential performance. Given that we are looking at CEZ a. s as potential shareholders, the cost of equity is used as the discount rate, rather than the cost of capital (or weighted average cost of capital, WACC) which accounts for debt. In this calculation we've used 6.1%, which is based on a levered beta of 0.800. Beta is a measure of a stock's volatility, compared to the market as a whole. We get our beta from the industry average beta of globally comparable companies, with an imposed limit between 0.8 and 2.0, which is a reasonable range for a stable business.
Next Steps:
Whilst important, the DCF calculation is only one of many factors that you need to assess for a company. DCF models are not the be-all and end-all of investment valuation. Instead the best use for a DCF model is to test certain assumptions and theories to see if they would lead to the company being undervalued or overvalued. For instance, if the terminal value growth rate is adjusted slightly, it can dramatically alter the overall result. What is the reason for the share price sitting below the intrinsic value? For CEZ a. s, we've put together three essential items you should explore:
- Risks: For instance, we've identified 3 warning signs for CEZ a. s that you should be aware of.
- Future Earnings: How does CEZ's growth rate compare to its peers and the wider market? Dig deeper into the analyst consensus number for the upcoming years by interacting with our free analyst growth expectation chart.
- Other High Quality Alternatives: Do you like a good all-rounder? Explore our interactive list of high quality stocks to get an idea of what else is out there you may be missing!
PS. Simply Wall St updates its DCF calculation for every Czech stock every day, so if you want to find the intrinsic value of any other stock just search here.
When trading CEZ a. s or any other investment, use the platform considered by many to be the Professional's Gateway to the Worlds Market, Interactive Brokers. You get the lowest-cost* trading on stocks, options, futures, forex, bonds and funds worldwide from a single integrated account. Promoted
Valuation is complex, but we're helping make it simple.
Find out whether CEZ a. s is potentially over or undervalued by checking out our comprehensive analysis, which includes fair value estimates, risks and warnings, dividends, insider transactions and financial health.
View the Free AnalysisThis article by Simply Wall St is general in nature. It does not constitute a recommendation to buy or sell any stock, and does not take account of your objectives, or your financial situation. We aim to bring you long-term focused analysis driven by fundamental data. Note that our analysis may not factor in the latest price-sensitive company announcements or qualitative material. Simply Wall St has no position in any stocks mentioned.
*Interactive Brokers Rated Lowest Cost Broker by StockBrokers.com Annual Online Review 2020
Have feedback on this article? Concerned about the content? Get in touch with us directly. Alternatively, email editorial-team (at) simplywallst.com.
About SEP:CEZ
CEZ a. s
Engages in the generation, distribution, trade, and sale of electricity and heat in Western, Central, and Southeastern Europe.
Mediocre balance sheet second-rate dividend payer.
