Stock Analysis
Interlife General Insurance (CSE:INLI) shareholder returns have been splendid, earning 236% in 5 years


When you buy a stock there is always a possibility that it could drop 100%. But on the bright side, if you buy shares in a high quality company at the right price, you can gain well over 100%. For instance, the price of Interlife General Insurance Company S.A. (CSE:INLI) stock is up an impressive 207% over the last five years. And in the last month, the share price has gained 31%.
Since it's been a strong week for Interlife General Insurance shareholders, let's have a look at trend of the longer term fundamentals.
View our latest analysis for Interlife General Insurance
In his essay The Superinvestors of Graham-and-Doddsville Warren Buffett described how share prices do not always rationally reflect the value of a business. One flawed but reasonable way to assess how sentiment around a company has changed is to compare the earnings per share (EPS) with the share price.
During five years of share price growth, Interlife General Insurance actually saw its EPS drop 19% per year.
Essentially, it doesn't seem likely that investors are focused on EPS. Because earnings per share don't seem to match up with the share price, we'll take a look at other metrics instead.
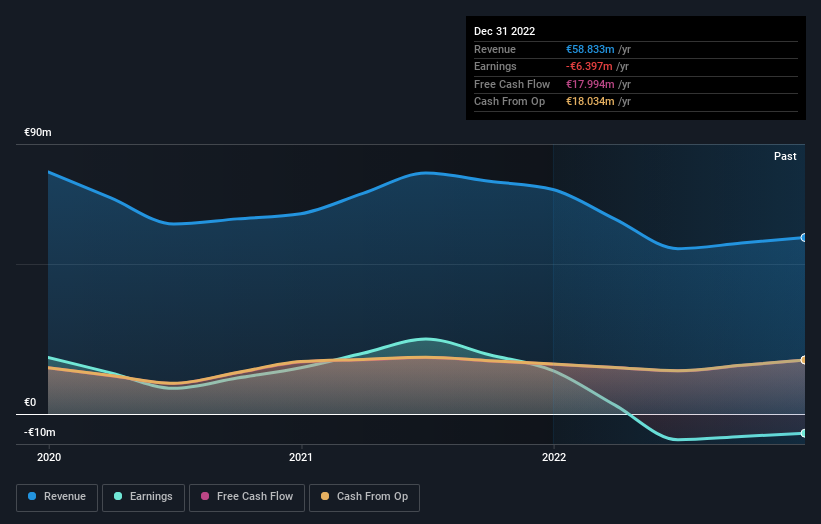
The revenue growth of 1.2% per year hardly seems impressive. So why is the share price up? It's not immediately obvious to us, but a closer look at the company's progress over time might yield answers.
The image below shows how earnings and revenue have tracked over time (if you click on the image you can see greater detail).
If you are thinking of buying or selling Interlife General Insurance stock, you should check out this FREE detailed report on its balance sheet.
What About Dividends?
As well as measuring the share price return, investors should also consider the total shareholder return (TSR). The TSR incorporates the value of any spin-offs or discounted capital raisings, along with any dividends, based on the assumption that the dividends are reinvested. It's fair to say that the TSR gives a more complete picture for stocks that pay a dividend. We note that for Interlife General Insurance the TSR over the last 5 years was 236%, which is better than the share price return mentioned above. This is largely a result of its dividend payments!
A Different Perspective
Interlife General Insurance shareholders gained a total return of 22% during the year. But that was short of the market average. It's probably a good sign that the company has an even better long term track record, having provided shareholders with an annual TSR of 27% over five years. It's quite possible the business continues to execute with prowess, even as the share price gains are slowing. While it is well worth considering the different impacts that market conditions can have on the share price, there are other factors that are even more important. Like risks, for instance. Every company has them, and we've spotted 3 warning signs for Interlife General Insurance (of which 2 can't be ignored!) you should know about.
But note: Interlife General Insurance may not be the best stock to buy. So take a peek at this free list of interesting companies with past earnings growth (and further growth forecast).
Please note, the market returns quoted in this article reflect the market weighted average returns of stocks that currently trade on Cypriot exchanges.
Valuation is complex, but we're helping make it simple.
Find out whether Interlife General Insurance is potentially over or undervalued by checking out our comprehensive analysis, which includes fair value estimates, risks and warnings, dividends, insider transactions and financial health.
View the Free AnalysisHave feedback on this article? Concerned about the content? Get in touch with us directly. Alternatively, email editorial-team (at) simplywallst.com.
This article by Simply Wall St is general in nature. We provide commentary based on historical data and analyst forecasts only using an unbiased methodology and our articles are not intended to be financial advice. It does not constitute a recommendation to buy or sell any stock, and does not take account of your objectives, or your financial situation. We aim to bring you long-term focused analysis driven by fundamental data. Note that our analysis may not factor in the latest price-sensitive company announcements or qualitative material. Simply Wall St has no position in any stocks mentioned.
About CSE:INLI
Interlife General Insurance
Interlife General Insurance Company S.A. operates as a general insurance company for individual and business in Greece.
Flawless balance sheet and fair value.
