
Advertisement
- China
- /
- Renewable Energy
- /
- SZSE:002210
The Return Trends At Shenzhen Feima International Supply Chain (SZSE:002210) Look Promising
Did you know there are some financial metrics that can provide clues of a potential multi-bagger? One common approach is to try and find a company with returns on capital employed (ROCE) that are increasing, in conjunction with a growing amount of capital employed. Basically this means that a company has profitable initiatives that it can continue to reinvest in, which is a trait of a compounding machine. With that in mind, we've noticed some promising trends at Shenzhen Feima International Supply Chain (SZSE:002210) so let's look a bit deeper.
Understanding Return On Capital Employed (ROCE)
For those who don't know, ROCE is a measure of a company's yearly pre-tax profit (its return), relative to the capital employed in the business. Analysts use this formula to calculate it for Shenzhen Feima International Supply Chain:
Return on Capital Employed = Earnings Before Interest and Tax (EBIT) ÷ (Total Assets - Current Liabilities)
0.075 = CN¥45m ÷ (CN¥1.3b - CN¥754m) (Based on the trailing twelve months to June 2024).
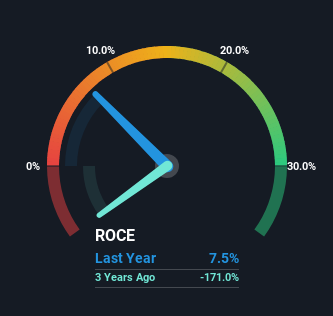
Therefore, Shenzhen Feima International Supply Chain has an ROCE of 7.5%. On its own that's a low return, but compared to the average of 5.6% generated by the Renewable Energy industry, it's much better.
Check out our latest analysis for Shenzhen Feima International Supply Chain
While the past is not representative of the future, it can be helpful to know how a company has performed historically, which is why we have this chart above. If you want to delve into the historical earnings , check out these free graphs detailing revenue and cash flow performance of Shenzhen Feima International Supply Chain.
What The Trend Of ROCE Can Tell Us
It's great to see that Shenzhen Feima International Supply Chain has started to generate some pre-tax earnings from prior investments. Historically the company was generating losses but as we can see from the latest figures referenced above, they're now earning 7.5% on their capital employed. At first glance, it seems the business is getting more proficient at generating returns, because over the same period, the amount of capital employed has reduced by 64%. This could potentially mean that the company is selling some of its assets.
On a related note, the company's ratio of current liabilities to total assets has decreased to 56%, which basically reduces it's funding from the likes of short-term creditors or suppliers. This tells us that Shenzhen Feima International Supply Chain has grown its returns without a reliance on increasing their current liabilities, which we're very happy with. Nevertheless, there are some potential risks the company is bearing with current liabilities that high, so just keep that in mind.
In Conclusion...
In the end, Shenzhen Feima International Supply Chain has proven it's capital allocation skills are good with those higher returns from less amount of capital. And investors seem to expect more of this going forward, since the stock has rewarded shareholders with a 41% return over the last five years. In light of that, we think it's worth looking further into this stock because if Shenzhen Feima International Supply Chain can keep these trends up, it could have a bright future ahead.
One final note, you should learn about the 2 warning signs we've spotted with Shenzhen Feima International Supply Chain (including 1 which doesn't sit too well with us) .
While Shenzhen Feima International Supply Chain isn't earning the highest return, check out this free list of companies that are earning high returns on equity with solid balance sheets.
New: Manage All Your Stock Portfolios in One Place
We've created the ultimate portfolio companion for stock investors, and it's free.
• Connect an unlimited number of Portfolios and see your total in one currency
• Be alerted to new Warning Signs or Risks via email or mobile
• Track the Fair Value of your stocks
Have feedback on this article? Concerned about the content? Get in touch with us directly. Alternatively, email editorial-team (at) simplywallst.com.
This article by Simply Wall St is general in nature. We provide commentary based on historical data and analyst forecasts only using an unbiased methodology and our articles are not intended to be financial advice. It does not constitute a recommendation to buy or sell any stock, and does not take account of your objectives, or your financial situation. We aim to bring you long-term focused analysis driven by fundamental data. Note that our analysis may not factor in the latest price-sensitive company announcements or qualitative material. Simply Wall St has no position in any stocks mentioned.
About SZSE:002210
Shenzhen Feima International Supply Chain
Shenzhen Feima International Supply Chain Co., Ltd.
Excellent balance sheet with low risk.
Market Insights

Advertisement
Community Narratives
MINISO's fair value is projected at 26.69 with an anticipated PE ratio shift of 20x
Fair Value US$24.03|11.0% undervalued
BE
Community Contributor
Procter & Gamble: A Dividend Giant Facing Slowing Growth
Fair Value US$119.81|23.3% overvalued
AN
Community Contributor
Eli Lilly's Future Growth Driven by Tirzepatide and Favorable Market Conditions
Fair Value US$1.19k|13.8% undervalued
EA
Community Contributor