
Advertisement
- China
- /
- Renewable Energy
- /
- SZSE:001286
Estimating The Intrinsic Value Of Shaanxi Energy Investment Co., Ltd. (SZSE:001286)

Key Insights
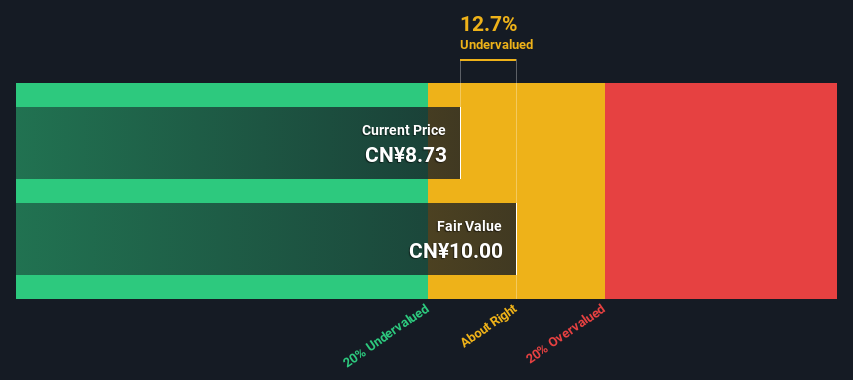
- Shaanxi Energy Investment's estimated fair value is CN¥10.00 based on 2 Stage Free Cash Flow to Equity
- With CN¥8.73 share price, Shaanxi Energy Investment appears to be trading close to its estimated fair value
- Shaanxi Energy Investment's peers are currently trading at a premium of 1,381% on average
Does the September share price for Shaanxi Energy Investment Co., Ltd. (SZSE:001286) reflect what it's really worth? Today, we will estimate the stock's intrinsic value by projecting its future cash flows and then discounting them to today's value. One way to achieve this is by employing the Discounted Cash Flow (DCF) model. Don't get put off by the jargon, the math behind it is actually quite straightforward.
Remember though, that there are many ways to estimate a company's value, and a DCF is just one method. If you want to learn more about discounted cash flow, the rationale behind this calculation can be read in detail in the Simply Wall St analysis model.
View our latest analysis for Shaanxi Energy Investment
The Model
We use what is known as a 2-stage model, which simply means we have two different periods of growth rates for the company's cash flows. Generally the first stage is higher growth, and the second stage is a lower growth phase. To begin with, we have to get estimates of the next ten years of cash flows. Seeing as no analyst estimates of free cash flow are available to us, we have extrapolate the previous free cash flow (FCF) from the company's last reported value. We assume companies with shrinking free cash flow will slow their rate of shrinkage, and that companies with growing free cash flow will see their growth rate slow, over this period. We do this to reflect that growth tends to slow more in the early years than it does in later years.
A DCF is all about the idea that a dollar in the future is less valuable than a dollar today, so we discount the value of these future cash flows to their estimated value in today's dollars:
10-year free cash flow (FCF) estimate
| 2025 | 2026 | 2027 | 2028 | 2029 | 2030 | 2031 | 2032 | 2033 | 2034 | |
| Levered FCF (CN¥, Millions) | CN¥2.03b | CN¥1.92b | CN¥1.85b | CN¥1.83b | CN¥1.83b | CN¥1.84b | CN¥1.87b | CN¥1.90b | CN¥1.94b | CN¥1.99b |
| Growth Rate Estimate Source | Est @ -9.41% | Est @ -5.73% | Est @ -3.16% | Est @ -1.36% | Est @ -0.09% | Est @ 0.79% | Est @ 1.41% | Est @ 1.84% | Est @ 2.14% | Est @ 2.36% |
| Present Value (CN¥, Millions) Discounted @ 7.1% | CN¥1.9k | CN¥1.7k | CN¥1.5k | CN¥1.4k | CN¥1.3k | CN¥1.2k | CN¥1.2k | CN¥1.1k | CN¥1.0k | CN¥1.0k |
("Est" = FCF growth rate estimated by Simply Wall St)
Present Value of 10-year Cash Flow (PVCF) = CN¥13b
The second stage is also known as Terminal Value, this is the business's cash flow after the first stage. The Gordon Growth formula is used to calculate Terminal Value at a future annual growth rate equal to the 5-year average of the 10-year government bond yield of 2.9%. We discount the terminal cash flows to today's value at a cost of equity of 7.1%.
Terminal Value (TV)= FCF2034 × (1 + g) ÷ (r – g) = CN¥2.0b× (1 + 2.9%) ÷ (7.1%– 2.9%) = CN¥48b
Present Value of Terminal Value (PVTV)= TV / (1 + r)10= CN¥48b÷ ( 1 + 7.1%)10= CN¥24b
The total value is the sum of cash flows for the next ten years plus the discounted terminal value, which results in the Total Equity Value, which in this case is CN¥38b. In the final step we divide the equity value by the number of shares outstanding. Compared to the current share price of CN¥8.7, the company appears about fair value at a 13% discount to where the stock price trades currently. Valuations are imprecise instruments though, rather like a telescope - move a few degrees and end up in a different galaxy. Do keep this in mind.
The Assumptions
We would point out that the most important inputs to a discounted cash flow are the discount rate and of course the actual cash flows. You don't have to agree with these inputs, I recommend redoing the calculations yourself and playing with them. The DCF also does not consider the possible cyclicality of an industry, or a company's future capital requirements, so it does not give a full picture of a company's potential performance. Given that we are looking at Shaanxi Energy Investment as potential shareholders, the cost of equity is used as the discount rate, rather than the cost of capital (or weighted average cost of capital, WACC) which accounts for debt. In this calculation we've used 7.1%, which is based on a levered beta of 0.854. Beta is a measure of a stock's volatility, compared to the market as a whole. We get our beta from the industry average beta of globally comparable companies, with an imposed limit between 0.8 and 2.0, which is a reasonable range for a stable business.
SWOT Analysis for Shaanxi Energy Investment
Strength
- Debt is well covered by earnings and cashflows.
- Dividends are covered by earnings and cash flows.
- Dividend is in the top 25% of dividend payers in the market.
Weakness
- Earnings growth over the past year underperformed the Renewable Energy industry.
Opportunity
- Annual earnings are forecast to grow for the next 3 years.
- Good value based on P/E ratio and estimated fair value.
Threat
- No apparent threats visible for 001286.
Looking Ahead:
Valuation is only one side of the coin in terms of building your investment thesis, and it is only one of many factors that you need to assess for a company. It's not possible to obtain a foolproof valuation with a DCF model. Preferably you'd apply different cases and assumptions and see how they would impact the company's valuation. For instance, if the terminal value growth rate is adjusted slightly, it can dramatically alter the overall result. For Shaanxi Energy Investment, there are three pertinent factors you should further research:
- Risks: Take risks, for example - Shaanxi Energy Investment has 2 warning signs we think you should be aware of.
- Future Earnings: How does 001286's growth rate compare to its peers and the wider market? Dig deeper into the analyst consensus number for the upcoming years by interacting with our free analyst growth expectation chart.
- Other Solid Businesses: Low debt, high returns on equity and good past performance are fundamental to a strong business. Why not explore our interactive list of stocks with solid business fundamentals to see if there are other companies you may not have considered!
PS. The Simply Wall St app conducts a discounted cash flow valuation for every stock on the SZSE every day. If you want to find the calculation for other stocks just search here.
New: Manage All Your Stock Portfolios in One Place
We've created the ultimate portfolio companion for stock investors, and it's free.
• Connect an unlimited number of Portfolios and see your total in one currency
• Be alerted to new Warning Signs or Risks via email or mobile
• Track the Fair Value of your stocks
Have feedback on this article? Concerned about the content? Get in touch with us directly. Alternatively, email editorial-team (at) simplywallst.com.
This article by Simply Wall St is general in nature. We provide commentary based on historical data and analyst forecasts only using an unbiased methodology and our articles are not intended to be financial advice. It does not constitute a recommendation to buy or sell any stock, and does not take account of your objectives, or your financial situation. We aim to bring you long-term focused analysis driven by fundamental data. Note that our analysis may not factor in the latest price-sensitive company announcements or qualitative material. Simply Wall St has no position in any stocks mentioned.
About SZSE:001286
Shaanxi Energy Investment
Engages in the thermal electricity and coal production business in China.
Fair value with acceptable track record.
Market Insights


Advertisement
Community Narratives
MicroStrategy: Volatile Gamble or Golden Opportunity?
Fair Value US$663.00|33.3% undervalued
BL
Community Contributor
Emerging Markets and Debt Reduction Will Propel Bath & Body Works Forward
Fair Value US$40.73|23.4% undervalued
ZW
Community Contributor
An amazing opportunity to potentially get a 100 bagger
Fair Value US$10.00|8.5% overvalued
DA
Community Contributor