
Advertisement
- China
- /
- Renewable Energy
- /
- SZSE:000601
GuangDong ShaoNeng Group Co., Ltd.'s (SZSE:000601) Shares Bounce 28% But Its Business Still Trails The Industry
GuangDong ShaoNeng Group Co., Ltd. (SZSE:000601) shareholders have had their patience rewarded with a 28% share price jump in the last month. The last 30 days bring the annual gain to a very sharp 42%.
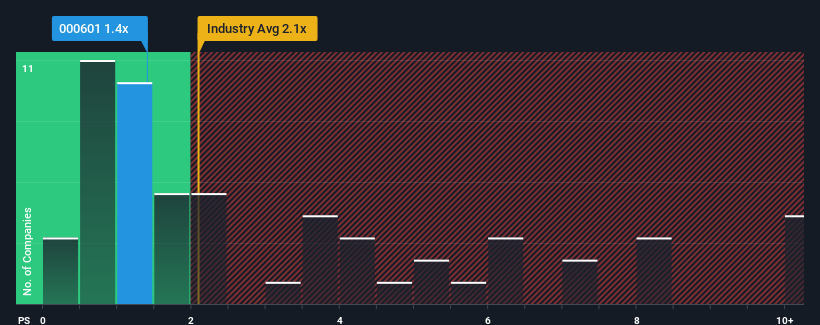
Although its price has surged higher, GuangDong ShaoNeng Group's price-to-sales (or "P/S") ratio of 1.4x might still make it look like a buy right now compared to the Renewable Energy industry in China, where around half of the companies have P/S ratios above 2.1x and even P/S above 6x are quite common. Although, it's not wise to just take the P/S at face value as there may be an explanation why it's limited.
Check out our latest analysis for GuangDong ShaoNeng Group
What Does GuangDong ShaoNeng Group's Recent Performance Look Like?
For example, consider that GuangDong ShaoNeng Group's financial performance has been poor lately as its revenue has been in decline. It might be that many expect the disappointing revenue performance to continue or accelerate, which has repressed the P/S. However, if this doesn't eventuate then existing shareholders may be feeling optimistic about the future direction of the share price.
We don't have analyst forecasts, but you can see how recent trends are setting up the company for the future by checking out our free report on GuangDong ShaoNeng Group's earnings, revenue and cash flow.Is There Any Revenue Growth Forecasted For GuangDong ShaoNeng Group?
The only time you'd be truly comfortable seeing a P/S as low as GuangDong ShaoNeng Group's is when the company's growth is on track to lag the industry.
Retrospectively, the last year delivered a frustrating 3.7% decrease to the company's top line. The last three years don't look nice either as the company has shrunk revenue by 28% in aggregate. Accordingly, shareholders would have felt downbeat about the medium-term rates of revenue growth.
Weighing that medium-term revenue trajectory against the broader industry's one-year forecast for expansion of 7.5% shows it's an unpleasant look.
With this in mind, we understand why GuangDong ShaoNeng Group's P/S is lower than most of its industry peers. Nonetheless, there's no guarantee the P/S has reached a floor yet with revenue going in reverse. There's potential for the P/S to fall to even lower levels if the company doesn't improve its top-line growth.
The Key Takeaway
GuangDong ShaoNeng Group's stock price has surged recently, but its but its P/S still remains modest. We'd say the price-to-sales ratio's power isn't primarily as a valuation instrument but rather to gauge current investor sentiment and future expectations.
Our examination of GuangDong ShaoNeng Group confirms that the company's shrinking revenue over the past medium-term is a key factor in its low price-to-sales ratio, given the industry is projected to grow. At this stage investors feel the potential for an improvement in revenue isn't great enough to justify a higher P/S ratio. If recent medium-term revenue trends continue, it's hard to see the share price moving strongly in either direction in the near future under these circumstances.
Having said that, be aware GuangDong ShaoNeng Group is showing 2 warning signs in our investment analysis, you should know about.
If companies with solid past earnings growth is up your alley, you may wish to see this free collection of other companies with strong earnings growth and low P/E ratios.
New: Manage All Your Stock Portfolios in One Place
We've created the ultimate portfolio companion for stock investors, and it's free.
• Connect an unlimited number of Portfolios and see your total in one currency
• Be alerted to new Warning Signs or Risks via email or mobile
• Track the Fair Value of your stocks
Have feedback on this article? Concerned about the content? Get in touch with us directly. Alternatively, email editorial-team (at) simplywallst.com.
This article by Simply Wall St is general in nature. We provide commentary based on historical data and analyst forecasts only using an unbiased methodology and our articles are not intended to be financial advice. It does not constitute a recommendation to buy or sell any stock, and does not take account of your objectives, or your financial situation. We aim to bring you long-term focused analysis driven by fundamental data. Note that our analysis may not factor in the latest price-sensitive company announcements or qualitative material. Simply Wall St has no position in any stocks mentioned.
About SZSE:000601
GuangDong ShaoNeng Group
Engages in hydropower, wind power, photovoltaics, energy storage, and biomass power generation activities in China.
Average dividend payer with low risk.
Market Insights

Advertisement
Community Narratives
MINISO's fair value is projected at 26.69 with an anticipated PE ratio shift of 20x
Fair Value US$24.03|11.0% undervalued
BE
Community Contributor
Procter & Gamble: A Dividend Giant Facing Slowing Growth
Fair Value US$119.81|23.3% overvalued
AN
Community Contributor
Eli Lilly's Future Growth Driven by Tirzepatide and Favorable Market Conditions
Fair Value US$1.19k|13.8% undervalued
EA
Community Contributor