- China
- /
- Renewable Energy
- /
- SZSE:000591
CECEP Solar EnergyLtd (SZSE:000591) shareholders have earned a 11% CAGR over the last five years


While CECEP Solar Energy Co.,Ltd. (SZSE:000591) shareholders are probably generally happy, the stock hasn't had particularly good run recently, with the share price falling 11% in the last quarter. Looking further back, the stock has generated good profits over five years. Its return of 55% has certainly bested the market return! Unfortunately not all shareholders will have held it for the long term, so spare a thought for those caught in the 28% decline over the last twelve months.
So let's assess the underlying fundamentals over the last 5 years and see if they've moved in lock-step with shareholder returns.
View our latest analysis for CECEP Solar EnergyLtd
To paraphrase Benjamin Graham: Over the short term the market is a voting machine, but over the long term it's a weighing machine. By comparing earnings per share (EPS) and share price changes over time, we can get a feel for how investor attitudes to a company have morphed over time.
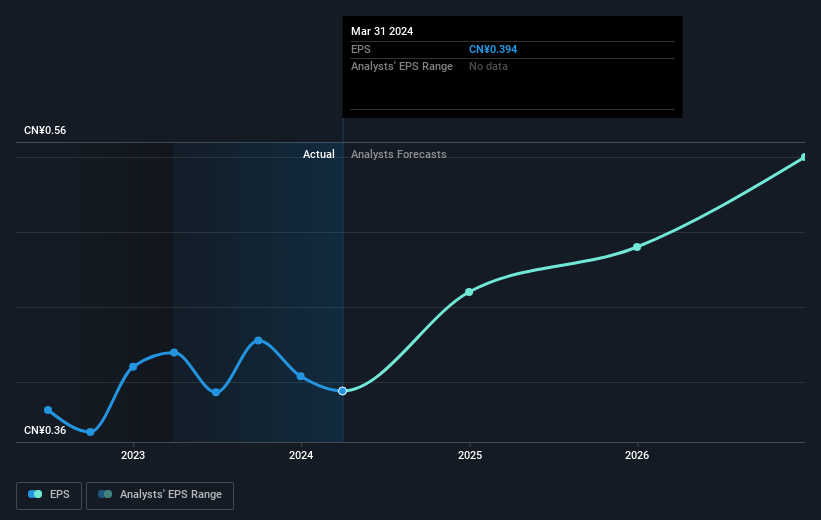
Over half a decade, CECEP Solar EnergyLtd managed to grow its earnings per share at 7.0% a year. This EPS growth is lower than the 9% average annual increase in the share price. So it's fair to assume the market has a higher opinion of the business than it did five years ago. That's not necessarily surprising considering the five-year track record of earnings growth.
The graphic below depicts how EPS has changed over time (unveil the exact values by clicking on the image).
It might be well worthwhile taking a look at our free report on CECEP Solar EnergyLtd's earnings, revenue and cash flow.
What About Dividends?
It is important to consider the total shareholder return, as well as the share price return, for any given stock. The TSR is a return calculation that accounts for the value of cash dividends (assuming that any dividend received was reinvested) and the calculated value of any discounted capital raisings and spin-offs. It's fair to say that the TSR gives a more complete picture for stocks that pay a dividend. In the case of CECEP Solar EnergyLtd, it has a TSR of 69% for the last 5 years. That exceeds its share price return that we previously mentioned. The dividends paid by the company have thusly boosted the total shareholder return.
A Different Perspective
While the broader market lost about 13% in the twelve months, CECEP Solar EnergyLtd shareholders did even worse, losing 27% (even including dividends). However, it could simply be that the share price has been impacted by broader market jitters. It might be worth keeping an eye on the fundamentals, in case there's a good opportunity. On the bright side, long term shareholders have made money, with a gain of 11% per year over half a decade. If the fundamental data continues to indicate long term sustainable growth, the current sell-off could be an opportunity worth considering. It's always interesting to track share price performance over the longer term. But to understand CECEP Solar EnergyLtd better, we need to consider many other factors. Consider for instance, the ever-present spectre of investment risk. We've identified 2 warning signs with CECEP Solar EnergyLtd (at least 1 which is significant) , and understanding them should be part of your investment process.
Of course CECEP Solar EnergyLtd may not be the best stock to buy. So you may wish to see this free collection of growth stocks.
Please note, the market returns quoted in this article reflect the market weighted average returns of stocks that currently trade on Chinese exchanges.
New: AI Stock Screener & Alerts
Our new AI Stock Screener scans the market every day to uncover opportunities.
• Dividend Powerhouses (3%+ Yield)
• Undervalued Small Caps with Insider Buying
• High growth Tech and AI Companies
Or build your own from over 50 metrics.
Have feedback on this article? Concerned about the content? Get in touch with us directly. Alternatively, email editorial-team (at) simplywallst.com.
This article by Simply Wall St is general in nature. We provide commentary based on historical data and analyst forecasts only using an unbiased methodology and our articles are not intended to be financial advice. It does not constitute a recommendation to buy or sell any stock, and does not take account of your objectives, or your financial situation. We aim to bring you long-term focused analysis driven by fundamental data. Note that our analysis may not factor in the latest price-sensitive company announcements or qualitative material. Simply Wall St has no position in any stocks mentioned.
About SZSE:000591
CECEP Solar EnergyLtd
Engages in the solar power generation business in China.
Fair value with acceptable track record.
