| Snowflake Score | |
|---|---|
| Valuation | 3/6 |
| Future Growth | 1/6 |
| Past Performance | 4/6 |
| Financial Health | 1/6 |
| Dividends | 4/6 |
Rewards
Risk Analysis
An Hui Wenergy Company Limited Competitors
Price History & Performance
| Historical stock prices | |
|---|---|
| Current Share Price | CN¥8.44 |
| 52 Week High | CN¥9.16 |
| 52 Week Low | CN¥5.53 |
| Beta | 0.32 |
| 11 Month Change | 4.07% |
| 3 Month Change | 7.79% |
| 1 Year Change | 25.41% |
| 33 Year Change | 116.97% |
| 5 Year Change | 75.83% |
| Change since IPO | 206.80% |
Recent News & Updates
Does An Hui Wenergy (SZSE:000543) Have A Healthy Balance Sheet?
Jun 22Investors Aren't Buying An Hui Wenergy Company Limited's (SZSE:000543) Earnings
May 22An Hui Wenergy Company Limited Just Missed EPS By 6.7%: Here's What Analysts Think Will Happen Next
Apr 19Recent updates
Does An Hui Wenergy (SZSE:000543) Have A Healthy Balance Sheet?
Jun 22Investors Aren't Buying An Hui Wenergy Company Limited's (SZSE:000543) Earnings
May 22An Hui Wenergy Company Limited Just Missed EPS By 6.7%: Here's What Analysts Think Will Happen Next
Apr 19An Hui Wenergy (SZSE:000543) Has A Somewhat Strained Balance Sheet
Mar 18Shareholder Returns
| 543 | CN Renewable Energy | CN Market | |
|---|---|---|---|
| 7D | -1.1% | -0.3% | -1.9% |
| 1Y | 25.4% | 16.5% | -15.8% |
Return vs Industry: 000543 exceeded the CN Renewable Energy industry which returned 16.5% over the past year.
Return vs Market: 000543 exceeded the CN Market which returned -15.8% over the past year.
Price Volatility
| 543 volatility | |
|---|---|
| 543 Average Weekly Movement | 4.8% |
| Renewable Energy Industry Average Movement | 4.5% |
| Market Average Movement | 6.7% |
| 10% most volatile stocks in CN Market | 10.2% |
| 10% least volatile stocks in CN Market | 4.1% |
Stable Share Price: 000543 has not had significant price volatility in the past 3 months.
Volatility Over Time: 000543's weekly volatility (5%) has been stable over the past year.
About the Company
| Founded | Employees | CEO | Website |
|---|---|---|---|
| 1993 | 4,958 | Shiqing Fang | www.wenergy.cn |
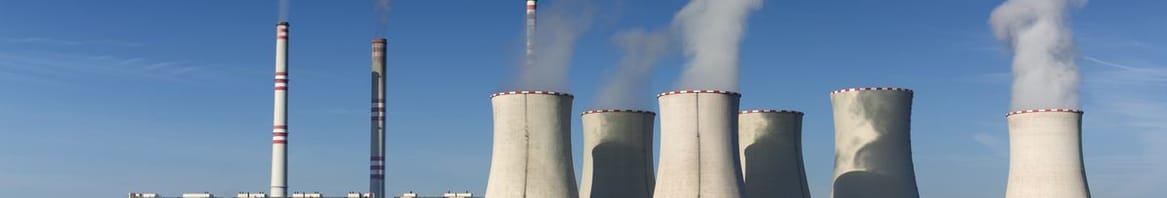
An Hui Wenergy Company Limited engages in the generation and supply of electricity in China. The company invests, builds, and generates electricity through coal-fired thermal power, hydropower, wind power, nuclear power, photovoltaic, and other energy sources, as well as environmental protection power units. It also supplies heat; and sells fly ash and coal.
An Hui Wenergy Company Limited Fundamentals Summary
| 543 fundamental statistics | |
|---|---|
| Market cap | CN¥19.13b |
| Earnings (TTM) | CN¥1.73b |
| Revenue (TTM) | CN¥28.64b |
11.1x
P/E Ratio0.7x
P/S RatioIs 543 overvalued?
See Fair Value and valuation analysisEarnings & Revenue
| 543 income statement (TTM) | |
|---|---|
| Revenue | CN¥28.64b |
| Cost of Revenue | CN¥26.35b |
| Gross Profit | CN¥2.29b |
| Other Expenses | CN¥569.79m |
| Earnings | CN¥1.73b |
Last Reported Earnings
Mar 31, 2024
Next Earnings Date
n/a
| Earnings per share (EPS) | 0.76 |
| Gross Margin | 8.01% |
| Net Profit Margin | 6.02% |
| Debt/Equity Ratio | 161.4% |
How did 543 perform over the long term?
See historical performance and comparison