
Advertisement
- China
- /
- Electric Utilities
- /
- SZSE:000037
Shenzhen Nanshan Power Co., Ltd. (SZSE:000037) Shares May Have Slumped 27% But Getting In Cheap Is Still Unlikely
Shenzhen Nanshan Power Co., Ltd. (SZSE:000037) shares have had a horrible month, losing 27% after a relatively good period beforehand. Longer-term shareholders would now have taken a real hit with the stock declining 9.3% in the last year.
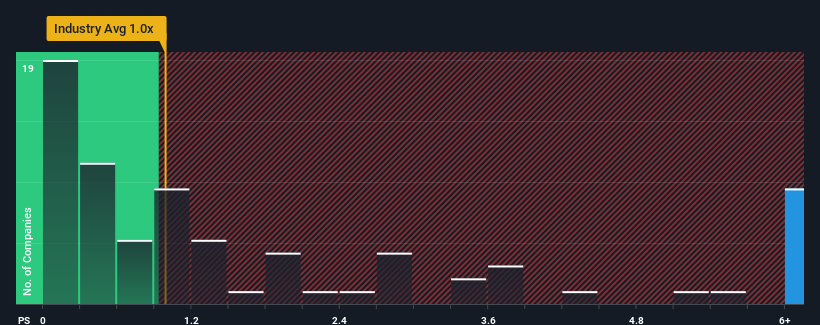
Even after such a large drop in price, when almost half of the companies in China's Electric Utilities industry have price-to-sales ratios (or "P/S") below 1.3x, you may still consider Shenzhen Nanshan Power as a stock not worth researching with its 7.3x P/S ratio. Although, it's not wise to just take the P/S at face value as there may be an explanation why it's so lofty.
See our latest analysis for Shenzhen Nanshan Power
How Shenzhen Nanshan Power Has Been Performing
As an illustration, revenue has deteriorated at Shenzhen Nanshan Power over the last year, which is not ideal at all. It might be that many expect the company to still outplay most other companies over the coming period, which has kept the P/S from collapsing. If not, then existing shareholders may be quite nervous about the viability of the share price.
Although there are no analyst estimates available for Shenzhen Nanshan Power, take a look at this free data-rich visualisation to see how the company stacks up on earnings, revenue and cash flow.What Are Revenue Growth Metrics Telling Us About The High P/S?
In order to justify its P/S ratio, Shenzhen Nanshan Power would need to produce outstanding growth that's well in excess of the industry.
In reviewing the last year of financials, we were disheartened to see the company's revenues fell to the tune of 10%. The last three years don't look nice either as the company has shrunk revenue by 49% in aggregate. Therefore, it's fair to say the revenue growth recently has been undesirable for the company.
Comparing that to the industry, which is predicted to deliver 10% growth in the next 12 months, the company's downward momentum based on recent medium-term revenue results is a sobering picture.
With this information, we find it concerning that Shenzhen Nanshan Power is trading at a P/S higher than the industry. It seems most investors are ignoring the recent poor growth rate and are hoping for a turnaround in the company's business prospects. There's a very good chance existing shareholders are setting themselves up for future disappointment if the P/S falls to levels more in line with the recent negative growth rates.
What We Can Learn From Shenzhen Nanshan Power's P/S?
Shenzhen Nanshan Power's shares may have suffered, but its P/S remains high. While the price-to-sales ratio shouldn't be the defining factor in whether you buy a stock or not, it's quite a capable barometer of revenue expectations.
Our examination of Shenzhen Nanshan Power revealed its shrinking revenue over the medium-term isn't resulting in a P/S as low as we expected, given the industry is set to grow. When we see revenue heading backwards and underperforming the industry forecasts, we feel the possibility of the share price declining is very real, bringing the P/S back into the realm of reasonability. Should recent medium-term revenue trends persist, it would pose a significant risk to existing shareholders' investments and prospective investors will have a hard time accepting the current value of the stock.
It is also worth noting that we have found 2 warning signs for Shenzhen Nanshan Power (1 doesn't sit too well with us!) that you need to take into consideration.
It's important to make sure you look for a great company, not just the first idea you come across. So if growing profitability aligns with your idea of a great company, take a peek at this free list of interesting companies with strong recent earnings growth (and a low P/E).
New: Manage All Your Stock Portfolios in One Place
We've created the ultimate portfolio companion for stock investors, and it's free.
• Connect an unlimited number of Portfolios and see your total in one currency
• Be alerted to new Warning Signs or Risks via email or mobile
• Track the Fair Value of your stocks
Have feedback on this article? Concerned about the content? Get in touch with us directly. Alternatively, email editorial-team (at) simplywallst.com.
This article by Simply Wall St is general in nature. We provide commentary based on historical data and analyst forecasts only using an unbiased methodology and our articles are not intended to be financial advice. It does not constitute a recommendation to buy or sell any stock, and does not take account of your objectives, or your financial situation. We aim to bring you long-term focused analysis driven by fundamental data. Note that our analysis may not factor in the latest price-sensitive company announcements or qualitative material. Simply Wall St has no position in any stocks mentioned.
About SZSE:000037
Adequate balance sheet with questionable track record.
Market Insights

Advertisement
Community Narratives
MINISO's fair value is projected at 26.69 with an anticipated PE ratio shift of 20x
Fair Value US$24.03|11.0% undervalued
BE
Community Contributor
Procter & Gamble: A Dividend Giant Facing Slowing Growth
Fair Value US$119.81|23.3% overvalued
AN
Community Contributor
Eli Lilly's Future Growth Driven by Tirzepatide and Favorable Market Conditions
Fair Value US$1.19k|13.8% undervalued
EA
Community Contributor