
Advertisement
- China
- /
- Electric Utilities
- /
- SHSE:600979
There's No Escaping Sichuan Guangan Aaa Public Co.,Ltd's (SHSE:600979) Muted Earnings Despite A 30% Share Price Rise
Sichuan Guangan Aaa Public Co.,Ltd (SHSE:600979) shares have continued their recent momentum with a 30% gain in the last month alone. Looking further back, the 22% rise over the last twelve months isn't too bad notwithstanding the strength over the last 30 days.
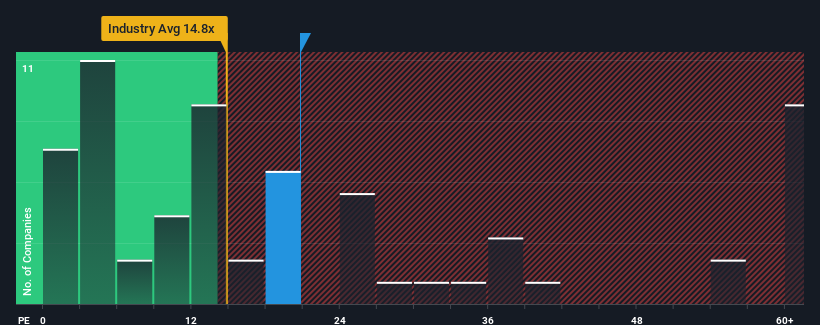
Even after such a large jump in price, Sichuan Guangan Aaa PublicLtd's price-to-earnings (or "P/E") ratio of 20.8x might still make it look like a buy right now compared to the market in China, where around half of the companies have P/E ratios above 33x and even P/E's above 61x are quite common. Although, it's not wise to just take the P/E at face value as there may be an explanation why it's limited.
Sichuan Guangan Aaa PublicLtd certainly has been doing a great job lately as it's been growing earnings at a really rapid pace. One possibility is that the P/E is low because investors think this strong earnings growth might actually underperform the broader market in the near future. If that doesn't eventuate, then existing shareholders have reason to be quite optimistic about the future direction of the share price.
See our latest analysis for Sichuan Guangan Aaa PublicLtd
How Is Sichuan Guangan Aaa PublicLtd's Growth Trending?
Sichuan Guangan Aaa PublicLtd's P/E ratio would be typical for a company that's only expected to deliver limited growth, and importantly, perform worse than the market.
If we review the last year of earnings growth, the company posted a terrific increase of 66%. The latest three year period has also seen a 27% overall rise in EPS, aided extensively by its short-term performance. Accordingly, shareholders would have probably been satisfied with the medium-term rates of earnings growth.
Weighing that recent medium-term earnings trajectory against the broader market's one-year forecast for expansion of 38% shows it's noticeably less attractive on an annualised basis.
In light of this, it's understandable that Sichuan Guangan Aaa PublicLtd's P/E sits below the majority of other companies. It seems most investors are expecting to see the recent limited growth rates continue into the future and are only willing to pay a reduced amount for the stock.
The Final Word
Despite Sichuan Guangan Aaa PublicLtd's shares building up a head of steam, its P/E still lags most other companies. Using the price-to-earnings ratio alone to determine if you should sell your stock isn't sensible, however it can be a practical guide to the company's future prospects.
As we suspected, our examination of Sichuan Guangan Aaa PublicLtd revealed its three-year earnings trends are contributing to its low P/E, given they look worse than current market expectations. Right now shareholders are accepting the low P/E as they concede future earnings probably won't provide any pleasant surprises. If recent medium-term earnings trends continue, it's hard to see the share price rising strongly in the near future under these circumstances.
Don't forget that there may be other risks. For instance, we've identified 4 warning signs for Sichuan Guangan Aaa PublicLtd (1 is significant) you should be aware of.
You might be able to find a better investment than Sichuan Guangan Aaa PublicLtd. If you want a selection of possible candidates, check out this free list of interesting companies that trade on a low P/E (but have proven they can grow earnings).
New: Manage All Your Stock Portfolios in One Place
We've created the ultimate portfolio companion for stock investors, and it's free.
• Connect an unlimited number of Portfolios and see your total in one currency
• Be alerted to new Warning Signs or Risks via email or mobile
• Track the Fair Value of your stocks
Have feedback on this article? Concerned about the content? Get in touch with us directly. Alternatively, email editorial-team (at) simplywallst.com.
This article by Simply Wall St is general in nature. We provide commentary based on historical data and analyst forecasts only using an unbiased methodology and our articles are not intended to be financial advice. It does not constitute a recommendation to buy or sell any stock, and does not take account of your objectives, or your financial situation. We aim to bring you long-term focused analysis driven by fundamental data. Note that our analysis may not factor in the latest price-sensitive company announcements or qualitative material. Simply Wall St has no position in any stocks mentioned.
About SHSE:600979
Sichuan Guangan Aaa PublicLtd
Engages in the electricity, gas, and water businesses in China.
Low risk with questionable track record.
Market Insights

Advertisement
Community Narratives
MINISO's fair value is projected at 26.69 with an anticipated PE ratio shift of 20x
Fair Value US$24.03|11.0% undervalued
BE
Community Contributor
Procter & Gamble: A Dividend Giant Facing Slowing Growth
Fair Value US$119.81|23.3% overvalued
AN
Community Contributor
Eli Lilly's Future Growth Driven by Tirzepatide and Favorable Market Conditions
Fair Value US$1.19k|13.8% undervalued
EA
Community Contributor