- China
- /
- Electric Utilities
- /
- SHSE:600509
Xinjiang Tianfu Energy (SHSE:600509) delivers shareholders notable 6.5% CAGR over 5 years, surging 7.9% in the last week alone


Generally speaking the aim of active stock picking is to find companies that provide returns that are superior to the market average. And in our experience, buying the right stocks can give your wealth a significant boost. For example, the Xinjiang Tianfu Energy Co., Ltd. (SHSE:600509) share price is up 33% in the last 5 years, clearly besting the market decline of around 7.9% (ignoring dividends).
On the back of a solid 7-day performance, let's check what role the company's fundamentals have played in driving long term shareholder returns.
See our latest analysis for Xinjiang Tianfu Energy
While markets are a powerful pricing mechanism, share prices reflect investor sentiment, not just underlying business performance. One way to examine how market sentiment has changed over time is to look at the interaction between a company's share price and its earnings per share (EPS).
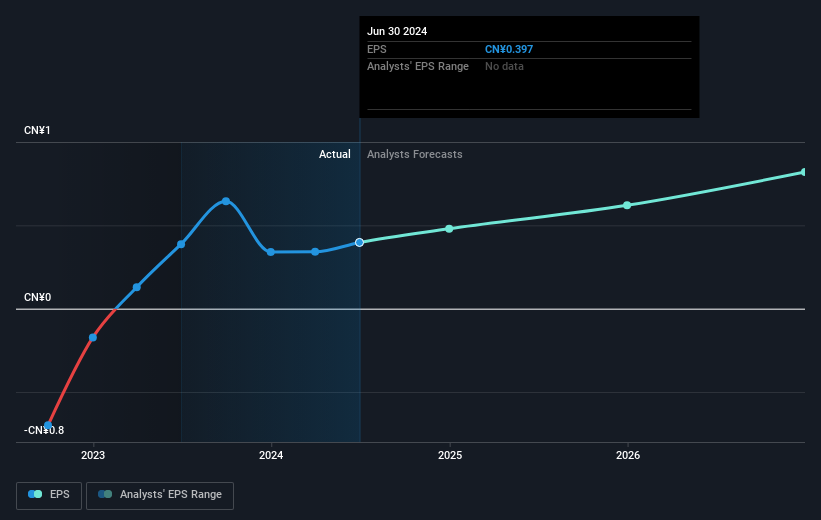
During the last half decade, Xinjiang Tianfu Energy became profitable. That's generally thought to be a genuine positive, so investors may expect to see an increasing share price. Since the company was unprofitable five years ago, but not three years ago, it's worth taking a look at the returns in the last three years, too. In fact, the Xinjiang Tianfu Energy stock price is 30% lower in the last three years. In the same period, EPS is up 34% per year. It would appear there's a real mismatch between the increasing EPS and the share price, which has declined -11% a year for three years.
The graphic below depicts how EPS has changed over time (unveil the exact values by clicking on the image).
We know that Xinjiang Tianfu Energy has improved its bottom line over the last three years, but what does the future have in store? This free interactive report on Xinjiang Tianfu Energy's balance sheet strength is a great place to start, if you want to investigate the stock further.
What About Dividends?
When looking at investment returns, it is important to consider the difference between total shareholder return (TSR) and share price return. The TSR incorporates the value of any spin-offs or discounted capital raisings, along with any dividends, based on the assumption that the dividends are reinvested. So for companies that pay a generous dividend, the TSR is often a lot higher than the share price return. In the case of Xinjiang Tianfu Energy, it has a TSR of 37% for the last 5 years. That exceeds its share price return that we previously mentioned. This is largely a result of its dividend payments!
A Different Perspective
While it's certainly disappointing to see that Xinjiang Tianfu Energy shares lost 16% throughout the year, that wasn't as bad as the market loss of 19%. Of course, the long term returns are far more important and the good news is that over five years, the stock has returned 7% for each year. In the best case scenario the last year is just a temporary blip on the journey to a brighter future. It's always interesting to track share price performance over the longer term. But to understand Xinjiang Tianfu Energy better, we need to consider many other factors. Take risks, for example - Xinjiang Tianfu Energy has 2 warning signs (and 1 which shouldn't be ignored) we think you should know about.
We will like Xinjiang Tianfu Energy better if we see some big insider buys. While we wait, check out this free list of undervalued stocks (mostly small caps) with considerable, recent, insider buying.
Please note, the market returns quoted in this article reflect the market weighted average returns of stocks that currently trade on Chinese exchanges.
New: AI Stock Screener & Alerts
Our new AI Stock Screener scans the market every day to uncover opportunities.
• Dividend Powerhouses (3%+ Yield)
• Undervalued Small Caps with Insider Buying
• High growth Tech and AI Companies
Or build your own from over 50 metrics.
Have feedback on this article? Concerned about the content? Get in touch with us directly. Alternatively, email editorial-team (at) simplywallst.com.
This article by Simply Wall St is general in nature. We provide commentary based on historical data and analyst forecasts only using an unbiased methodology and our articles are not intended to be financial advice. It does not constitute a recommendation to buy or sell any stock, and does not take account of your objectives, or your financial situation. We aim to bring you long-term focused analysis driven by fundamental data. Note that our analysis may not factor in the latest price-sensitive company announcements or qualitative material. Simply Wall St has no position in any stocks mentioned.
About SHSE:600509
Xinjiang Tianfu Energy
Engages in the production and supply of electricity and heat in the Shihezi area in Xinjiang.
Undervalued with moderate growth potential.

