- China
- /
- Transportation
- /
- SHSE:600620
Why We're Not Concerned Yet About Shanghai Tianchen Co.,Ltd's (SHSE:600620) 28% Share Price Plunge
To the annoyance of some shareholders, Shanghai Tianchen Co.,Ltd (SHSE:600620) shares are down a considerable 28% in the last month, which continues a horrid run for the company. The recent drop completes a disastrous twelve months for shareholders, who are sitting on a 58% loss during that time.
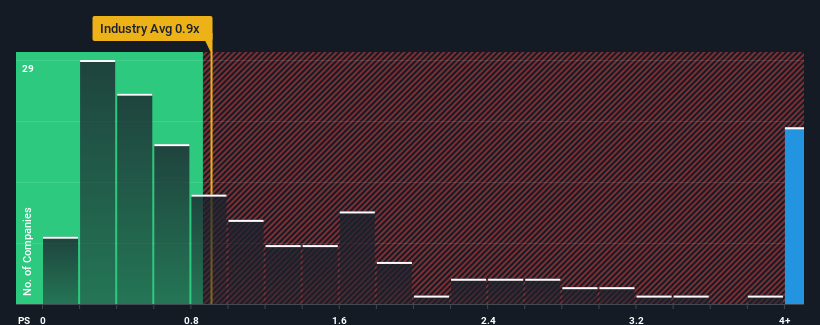
Although its price has dipped substantially, you could still be forgiven for thinking Shanghai TianchenLtd is a stock to steer clear of with a price-to-sales ratios (or "P/S") of 12.2x, considering almost half the companies in China's Transportation industry have P/S ratios below 2.4x. Nonetheless, we'd need to dig a little deeper to determine if there is a rational basis for the highly elevated P/S.
See our latest analysis for Shanghai TianchenLtd

What Does Shanghai TianchenLtd's Recent Performance Look Like?
Shanghai TianchenLtd has been doing a good job lately as it's been growing revenue at a solid pace. Perhaps the market is expecting this decent revenue performance to beat out the industry over the near term, which has kept the P/S propped up. If not, then existing shareholders may be a little nervous about the viability of the share price.
Want the full picture on earnings, revenue and cash flow for the company? Then our free report on Shanghai TianchenLtd will help you shine a light on its historical performance.Is There Enough Revenue Growth Forecasted For Shanghai TianchenLtd?
Shanghai TianchenLtd's P/S ratio would be typical for a company that's expected to deliver very strong growth, and importantly, perform much better than the industry.
If we review the last year of revenue growth, the company posted a terrific increase of 22%. The latest three year period has also seen an incredible overall rise in revenue, aided by its incredible short-term performance. So we can start by confirming that the company has done a tremendous job of growing revenue over that time.
When compared to the industry's one-year growth forecast of 19%, the most recent medium-term revenue trajectory is noticeably more alluring
With this information, we can see why Shanghai TianchenLtd is trading at such a high P/S compared to the industry. Presumably shareholders aren't keen to offload something they believe will continue to outmanoeuvre the wider industry.
What Does Shanghai TianchenLtd's P/S Mean For Investors?
Shanghai TianchenLtd's shares may have suffered, but its P/S remains high. It's argued the price-to-sales ratio is an inferior measure of value within certain industries, but it can be a powerful business sentiment indicator.
It's no surprise that Shanghai TianchenLtd can support its high P/S given the strong revenue growth its experienced over the last three-year is superior to the current industry outlook. At this stage investors feel the potential continued revenue growth in the future is great enough to warrant an inflated P/S. Barring any significant changes to the company's ability to make money, the share price should continue to be propped up.
It is also worth noting that we have found 2 warning signs for Shanghai TianchenLtd (1 makes us a bit uncomfortable!) that you need to take into consideration.
Of course, profitable companies with a history of great earnings growth are generally safer bets. So you may wish to see this free collection of other companies that have reasonable P/E ratios and have grown earnings strongly.
New: Manage All Your Stock Portfolios in One Place
We've created the ultimate portfolio companion for stock investors, and it's free.
• Connect an unlimited number of Portfolios and see your total in one currency
• Be alerted to new Warning Signs or Risks via email or mobile
• Track the Fair Value of your stocks
Have feedback on this article? Concerned about the content? Get in touch with us directly. Alternatively, email editorial-team (at) simplywallst.com.
This article by Simply Wall St is general in nature. We provide commentary based on historical data and analyst forecasts only using an unbiased methodology and our articles are not intended to be financial advice. It does not constitute a recommendation to buy or sell any stock, and does not take account of your objectives, or your financial situation. We aim to bring you long-term focused analysis driven by fundamental data. Note that our analysis may not factor in the latest price-sensitive company announcements or qualitative material. Simply Wall St has no position in any stocks mentioned.
About SHSE:600620
Shanghai TianchenLtd
Provides taxi passenger transportation services in China.
Proven track record with adequate balance sheet.
Market Insights
Community Narratives


