
Advertisement
- China
- /
- Communications
- /
- SZSE:301318
ValueHD Corporation's (SZSE:301318) Financials Are Too Obscure To Link With Current Share Price Momentum: What's In Store For the Stock?
Most readers would already be aware that ValueHD's (SZSE:301318) stock increased significantly by 10% over the past week. However, we wonder if the company's inconsistent financials would have any adverse impact on the current share price momentum. In this article, we decided to focus on ValueHD's ROE.
Return on Equity or ROE is a test of how effectively a company is growing its value and managing investors’ money. In short, ROE shows the profit each dollar generates with respect to its shareholder investments.
View our latest analysis for ValueHD
How Is ROE Calculated?
Return on equity can be calculated by using the formula:
Return on Equity = Net Profit (from continuing operations) ÷ Shareholders' Equity
So, based on the above formula, the ROE for ValueHD is:
5.1% = CN¥92m ÷ CN¥1.8b (Based on the trailing twelve months to September 2024).
The 'return' is the amount earned after tax over the last twelve months. That means that for every CN¥1 worth of shareholders' equity, the company generated CN¥0.05 in profit.
What Is The Relationship Between ROE And Earnings Growth?
So far, we've learned that ROE is a measure of a company's profitability. We now need to evaluate how much profit the company reinvests or "retains" for future growth which then gives us an idea about the growth potential of the company. Assuming all else is equal, companies that have both a higher return on equity and higher profit retention are usually the ones that have a higher growth rate when compared to companies that don't have the same features.
A Side By Side comparison of ValueHD's Earnings Growth And 5.1% ROE
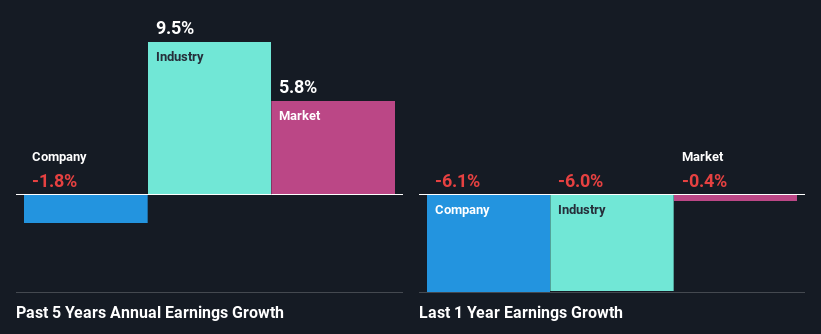
When you first look at it, ValueHD's ROE doesn't look that attractive. Yet, a closer study shows that the company's ROE is similar to the industry average of 5.1%. Having said that, ValueHD's net income growth over the past five years is more or less flat. Remember, the company's ROE is not particularly great to begin with. Hence, this provides some context to the flat earnings growth seen by the company.
We then compared ValueHD's net income growth with the industry and found that the average industry growth rate was 9.5% in the same 5-year period.
The basis for attaching value to a company is, to a great extent, tied to its earnings growth. What investors need to determine next is if the expected earnings growth, or the lack of it, is already built into the share price. Doing so will help them establish if the stock's future looks promising or ominous. One good indicator of expected earnings growth is the P/E ratio which determines the price the market is willing to pay for a stock based on its earnings prospects. So, you may want to check if ValueHD is trading on a high P/E or a low P/E, relative to its industry.
Is ValueHD Making Efficient Use Of Its Profits?
ValueHD's low three-year median payout ratio of 21%, (meaning the company retains79% of profits) should mean that the company is retaining most of its earnings and consequently, should see higher growth than it has reported.
Additionally, ValueHD has paid dividends over a period of three years, which means that the company's management is determined to pay dividends even if it means little to no earnings growth.
Conclusion
In total, we're a bit ambivalent about ValueHD's performance. While the company does have a high rate of profit retention, its low rate of return is probably hampering its earnings growth. Up till now, we've only made a short study of the company's growth data. To gain further insights into ValueHD's past profit growth, check out this visualization of past earnings, revenue and cash flows.
New: Manage All Your Stock Portfolios in One Place
We've created the ultimate portfolio companion for stock investors, and it's free.
• Connect an unlimited number of Portfolios and see your total in one currency
• Be alerted to new Warning Signs or Risks via email or mobile
• Track the Fair Value of your stocks
Have feedback on this article? Concerned about the content? Get in touch with us directly. Alternatively, email editorial-team (at) simplywallst.com.
This article by Simply Wall St is general in nature. We provide commentary based on historical data and analyst forecasts only using an unbiased methodology and our articles are not intended to be financial advice. It does not constitute a recommendation to buy or sell any stock, and does not take account of your objectives, or your financial situation. We aim to bring you long-term focused analysis driven by fundamental data. Note that our analysis may not factor in the latest price-sensitive company announcements or qualitative material. Simply Wall St has no position in any stocks mentioned.
About SZSE:301318
Flawless balance sheet with proven track record.
Similar Companies
Market Insights

Advertisement
Community Narratives
MINISO's fair value is projected at 26.69 with an anticipated PE ratio shift of 20x
Fair Value US$24.03|9.0% undervalued
BE
Community Contributor
Procter & Gamble: A Dividend Giant Facing Slowing Growth
Fair Value US$119.81|23.5% overvalued
AN
Community Contributor
Eli Lilly's Future Growth Driven by Tirzepatide and Favorable Market Conditions
Fair Value US$1.19k|14.4% undervalued
EA
Community Contributor