
Advertisement
- China
- /
- Tech Hardware
- /
- SZSE:301067
Capital Allocation Trends At Fullink TechnologyLtd (SZSE:301067) Aren't Ideal
What trends should we look for it we want to identify stocks that can multiply in value over the long term? Amongst other things, we'll want to see two things; firstly, a growing return on capital employed (ROCE) and secondly, an expansion in the company's amount of capital employed. Put simply, these types of businesses are compounding machines, meaning they are continually reinvesting their earnings at ever-higher rates of return. Having said that, from a first glance at Fullink TechnologyLtd (SZSE:301067) we aren't jumping out of our chairs at how returns are trending, but let's have a deeper look.
Understanding Return On Capital Employed (ROCE)
For those that aren't sure what ROCE is, it measures the amount of pre-tax profits a company can generate from the capital employed in its business. Analysts use this formula to calculate it for Fullink TechnologyLtd:
Return on Capital Employed = Earnings Before Interest and Tax (EBIT) ÷ (Total Assets - Current Liabilities)
0.021 = CN¥19m ÷ (CN¥1.2b - CN¥313m) (Based on the trailing twelve months to September 2023).
Therefore, Fullink TechnologyLtd has an ROCE of 2.1%. In absolute terms, that's a low return and it also under-performs the Tech industry average of 6.0%.
See our latest analysis for Fullink TechnologyLtd
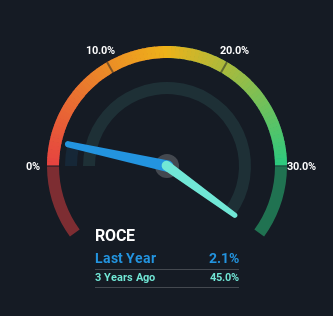
Historical performance is a great place to start when researching a stock so above you can see the gauge for Fullink TechnologyLtd's ROCE against it's prior returns. If you're interested in investigating Fullink TechnologyLtd's past further, check out this free graph covering Fullink TechnologyLtd's past earnings, revenue and cash flow.
So How Is Fullink TechnologyLtd's ROCE Trending?
In terms of Fullink TechnologyLtd's historical ROCE movements, the trend isn't fantastic. To be more specific, ROCE has fallen from 23% over the last five years. Given the business is employing more capital while revenue has slipped, this is a bit concerning. If this were to continue, you might be looking at a company that is trying to reinvest for growth but is actually losing market share since sales haven't increased.
On a related note, Fullink TechnologyLtd has decreased its current liabilities to 25% of total assets. That could partly explain why the ROCE has dropped. Effectively this means their suppliers or short-term creditors are funding less of the business, which reduces some elements of risk. Since the business is basically funding more of its operations with it's own money, you could argue this has made the business less efficient at generating ROCE.
What We Can Learn From Fullink TechnologyLtd's ROCE
In summary, we're somewhat concerned by Fullink TechnologyLtd's diminishing returns on increasing amounts of capital. Long term shareholders who've owned the stock over the last year have experienced a 11% depreciation in their investment, so it appears the market might not like these trends either. That being the case, unless the underlying trends revert to a more positive trajectory, we'd consider looking elsewhere.
Fullink TechnologyLtd does come with some risks though, we found 3 warning signs in our investment analysis, and 2 of those are concerning...
While Fullink TechnologyLtd isn't earning the highest return, check out this free list of companies that are earning high returns on equity with solid balance sheets.
New: AI Stock Screener & Alerts
Our new AI Stock Screener scans the market every day to uncover opportunities.
• Dividend Powerhouses (3%+ Yield)
• Undervalued Small Caps with Insider Buying
• High growth Tech and AI Companies
Or build your own from over 50 metrics.
Have feedback on this article? Concerned about the content? Get in touch with us directly. Alternatively, email editorial-team (at) simplywallst.com.
This article by Simply Wall St is general in nature. We provide commentary based on historical data and analyst forecasts only using an unbiased methodology and our articles are not intended to be financial advice. It does not constitute a recommendation to buy or sell any stock, and does not take account of your objectives, or your financial situation. We aim to bring you long-term focused analysis driven by fundamental data. Note that our analysis may not factor in the latest price-sensitive company announcements or qualitative material. Simply Wall St has no position in any stocks mentioned.
About SZSE:301067
Fullink TechnologyLtd
Engages in the research and development, production, and sales of computer, communication, and consumer electronics peripheral products and components in China.
Slight risk with mediocre balance sheet.
Market Insights

Advertisement
Community Narratives
MicroVision will explode future revenue by 380.37% with a vision towards success
Fair Value US$60.00|98.4% undervalued
TH
Community Contributor
The Indispensable Artery for a New North American Economy
Fair Value CA$132.87|1.3% undervalued
TI
Community Contributor