
Advertisement
- China
- /
- Electronic Equipment and Components
- /
- SZSE:300916
Earnings Not Telling The Story For Shenzhen Longtech Smart Control Co., Ltd. (SZSE:300916) After Shares Rise 43%
The Shenzhen Longtech Smart Control Co., Ltd. (SZSE:300916) share price has done very well over the last month, posting an excellent gain of 43%. Not all shareholders will be feeling jubilant, since the share price is still down a very disappointing 15% in the last twelve months.
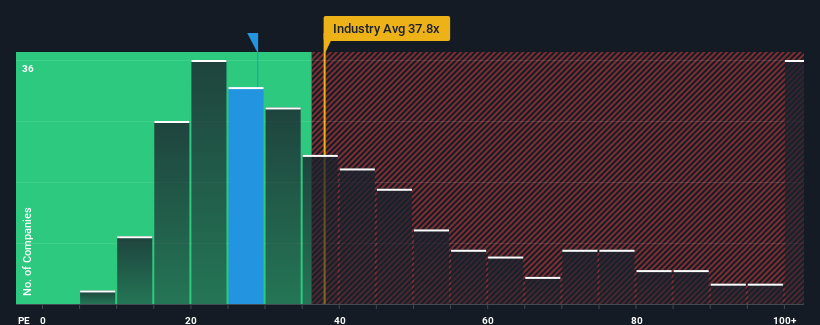
In spite of the firm bounce in price, there still wouldn't be many who think Shenzhen Longtech Smart Control's price-to-earnings (or "P/E") ratio of 28.9x is worth a mention when the median P/E in China is similar at about 29x. While this might not raise any eyebrows, if the P/E ratio is not justified investors could be missing out on a potential opportunity or ignoring looming disappointment.
As an illustration, earnings have deteriorated at Shenzhen Longtech Smart Control over the last year, which is not ideal at all. It might be that many expect the company to put the disappointing earnings performance behind them over the coming period, which has kept the P/E from falling. If not, then existing shareholders may be a little nervous about the viability of the share price.
See our latest analysis for Shenzhen Longtech Smart Control
What Are Growth Metrics Telling Us About The P/E?
Shenzhen Longtech Smart Control's P/E ratio would be typical for a company that's only expected to deliver moderate growth, and importantly, perform in line with the market.
Taking a look back first, the company's earnings per share growth last year wasn't something to get excited about as it posted a disappointing decline of 13%. This has soured the latest three-year period, which nevertheless managed to deliver a decent 24% overall rise in EPS. Although it's been a bumpy ride, it's still fair to say the earnings growth recently has been mostly respectable for the company.
Weighing that recent medium-term earnings trajectory against the broader market's one-year forecast for expansion of 35% shows it's noticeably less attractive on an annualised basis.
With this information, we find it interesting that Shenzhen Longtech Smart Control is trading at a fairly similar P/E to the market. It seems most investors are ignoring the fairly limited recent growth rates and are willing to pay up for exposure to the stock. Maintaining these prices will be difficult to achieve as a continuation of recent earnings trends is likely to weigh down the shares eventually.
What We Can Learn From Shenzhen Longtech Smart Control's P/E?
Shenzhen Longtech Smart Control's stock has a lot of momentum behind it lately, which has brought its P/E level with the market. Generally, our preference is to limit the use of the price-to-earnings ratio to establishing what the market thinks about the overall health of a company.
We've established that Shenzhen Longtech Smart Control currently trades on a higher than expected P/E since its recent three-year growth is lower than the wider market forecast. When we see weak earnings with slower than market growth, we suspect the share price is at risk of declining, sending the moderate P/E lower. Unless the recent medium-term conditions improve, it's challenging to accept these prices as being reasonable.
You should always think about risks. Case in point, we've spotted 2 warning signs for Shenzhen Longtech Smart Control you should be aware of, and 1 of them is a bit unpleasant.
If you're unsure about the strength of Shenzhen Longtech Smart Control's business, why not explore our interactive list of stocks with solid business fundamentals for some other companies you may have missed.
New: Manage All Your Stock Portfolios in One Place
We've created the ultimate portfolio companion for stock investors, and it's free.
• Connect an unlimited number of Portfolios and see your total in one currency
• Be alerted to new Warning Signs or Risks via email or mobile
• Track the Fair Value of your stocks
Have feedback on this article? Concerned about the content? Get in touch with us directly. Alternatively, email editorial-team (at) simplywallst.com.
This article by Simply Wall St is general in nature. We provide commentary based on historical data and analyst forecasts only using an unbiased methodology and our articles are not intended to be financial advice. It does not constitute a recommendation to buy or sell any stock, and does not take account of your objectives, or your financial situation. We aim to bring you long-term focused analysis driven by fundamental data. Note that our analysis may not factor in the latest price-sensitive company announcements or qualitative material. Simply Wall St has no position in any stocks mentioned.
About SZSE:300916
Shenzhen Longtech Smart Control
Shenzhen Longtech Smart Control Co., Ltd.
Excellent balance sheet and slightly overvalued.
Market Insights

Advertisement
Community Narratives
MicroVision will explode future revenue by 380.37% with a vision towards success
Fair Value US$60|98.4% undervalued
TH
Community Contributor
The Indispensable Artery for a New North American Economy
Fair Value CA$132.87|0.7% overvalued
TI
Community Contributor
Recently Updated Narratives
CE

cementafriend on Constellation Energy ·
Constellation Energy Dividends and Growth
Fair Value:US$348.054.7% overvalued
2 followersusers have followed this narrative
0 commentsusers have commented on this narrative
0 likesusers have liked this narrative
KH

Khagani on CoreWeave ·
CoreWeave's Revenue Expected to Rocket 77.88% in 5-Year Forecast
Fair Value:US$11033.5% undervalued
3 followersusers have followed this narrative
0 commentsusers have commented on this narrative
0 likesusers have liked this narrative
PO

PortfolioPlus on Bisalloy Steel Group ·
Bisalloy Steel Group will shine with a projected profit margin increase of 12.8%
Fair Value:AU$6.7118.0% undervalued
2 followersusers have followed this narrative
0 commentsusers have commented on this narrative
0 likesusers have liked this narrative
Popular Narratives
TH

TheWallstreetKing on MicroVision ·
MicroVision will explode future revenue by 380.37% with a vision towards success
Fair Value:US$6098.4% undervalued
105 followersusers have followed this narrative
10 commentsusers have commented on this narrative
20 likesusers have liked this narrative
AN


AnalystConsensusTarget on NVIDIA ·
NVDA: Expanding AI Demand Will Drive Major Data Center Investments Through 2026
Fair Value:US$250.3929.3% undervalued
935 followersusers have followed this narrative
6 commentsusers have commented on this narrative
23 likesusers have liked this narrative
OS


oscargarcia on Alphabet ·
The company that turned a verb into a global necessity and basically runs the modern internet, digital ads, smartphones, maps, and AI.
Fair Value:US$3405.8% undervalued
142 followersusers have followed this narrative
6 commentsusers have commented on this narrative
18 likesusers have liked this narrative