
Advertisement
- China
- /
- Electronic Equipment and Components
- /
- SZSE:300440
Chengdu Yunda Technology Co., Ltd. (SZSE:300440) Shares Fly 39% But Investors Aren't Buying For Growth
Chengdu Yunda Technology Co., Ltd. (SZSE:300440) shareholders are no doubt pleased to see that the share price has bounced 39% in the last month, although it is still struggling to make up recently lost ground. Not all shareholders will be feeling jubilant, since the share price is still down a very disappointing 21% in the last twelve months.
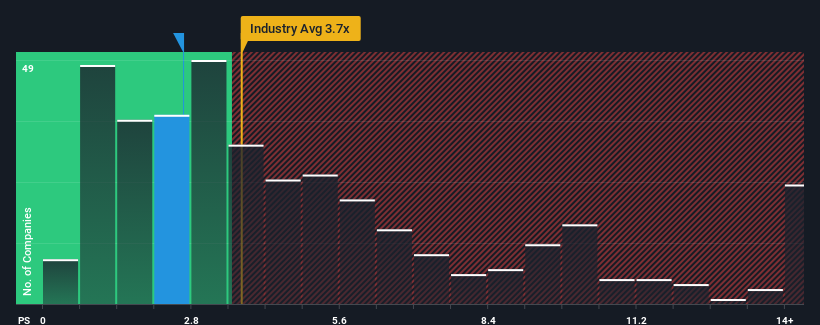
Although its price has surged higher, Chengdu Yunda Technology may still be sending bullish signals at the moment with its price-to-sales (or "P/S") ratio of 2.6x, since almost half of all companies in the Electronic industry in China have P/S ratios greater than 3.7x and even P/S higher than 7x are not unusual. Although, it's not wise to just take the P/S at face value as there may be an explanation why it's limited.
See our latest analysis for Chengdu Yunda Technology
How Chengdu Yunda Technology Has Been Performing
Revenue has risen firmly for Chengdu Yunda Technology recently, which is pleasing to see. One possibility is that the P/S is low because investors think this respectable revenue growth might actually underperform the broader industry in the near future. Those who are bullish on Chengdu Yunda Technology will be hoping that this isn't the case, so that they can pick up the stock at a lower valuation.
We don't have analyst forecasts, but you can see how recent trends are setting up the company for the future by checking out our free report on Chengdu Yunda Technology's earnings, revenue and cash flow.Is There Any Revenue Growth Forecasted For Chengdu Yunda Technology?
There's an inherent assumption that a company should underperform the industry for P/S ratios like Chengdu Yunda Technology's to be considered reasonable.
Taking a look back first, we see that the company managed to grow revenues by a handy 9.0% last year. This was backed up an excellent period prior to see revenue up by 34% in total over the last three years. So we can start by confirming that the company has done a great job of growing revenues over that time.
This is in contrast to the rest of the industry, which is expected to grow by 25% over the next year, materially higher than the company's recent medium-term annualised growth rates.
In light of this, it's understandable that Chengdu Yunda Technology's P/S sits below the majority of other companies. It seems most investors are expecting to see the recent limited growth rates continue into the future and are only willing to pay a reduced amount for the stock.
The Key Takeaway
Chengdu Yunda Technology's stock price has surged recently, but its but its P/S still remains modest. It's argued the price-to-sales ratio is an inferior measure of value within certain industries, but it can be a powerful business sentiment indicator.
Our examination of Chengdu Yunda Technology confirms that the company's revenue trends over the past three-year years are a key factor in its low price-to-sales ratio, as we suspected, given they fall short of current industry expectations. Right now shareholders are accepting the low P/S as they concede future revenue probably won't provide any pleasant surprises. If recent medium-term revenue trends continue, it's hard to see the share price experience a reversal of fortunes anytime soon.
Before you take the next step, you should know about the 4 warning signs for Chengdu Yunda Technology (1 shouldn't be ignored!) that we have uncovered.
Of course, profitable companies with a history of great earnings growth are generally safer bets. So you may wish to see this free collection of other companies that have reasonable P/E ratios and have grown earnings strongly.
New: AI Stock Screener & Alerts
Our new AI Stock Screener scans the market every day to uncover opportunities.
• Dividend Powerhouses (3%+ Yield)
• Undervalued Small Caps with Insider Buying
• High growth Tech and AI Companies
Or build your own from over 50 metrics.
Have feedback on this article? Concerned about the content? Get in touch with us directly. Alternatively, email editorial-team (at) simplywallst.com.
This article by Simply Wall St is general in nature. We provide commentary based on historical data and analyst forecasts only using an unbiased methodology and our articles are not intended to be financial advice. It does not constitute a recommendation to buy or sell any stock, and does not take account of your objectives, or your financial situation. We aim to bring you long-term focused analysis driven by fundamental data. Note that our analysis may not factor in the latest price-sensitive company announcements or qualitative material. Simply Wall St has no position in any stocks mentioned.
About SZSE:300440
Chengdu Yunda Technology
Engages in the research and development, production, and sale of rail transit intelligent systems and solutions in China.
Excellent balance sheet with slight risk.
Market Insights

Advertisement
Community Narratives
The company that turned a verb into a global necessity and basically runs the modern internet, digital ads, smartphones, maps, and AI.
Fair Value US$300.00|6.3% undervalued
OS
Community Contributor
Flowers Foods Pays A Fair Price For Health
Fair Value US$16.12|26.0% undervalued
NV
Community Contributor
TMX Group will thrive with 33.3% profit margin and enduring market moat
Fair Value CA$49.90|3.7% overvalued
LI
Community Contributor