- China
- /
- Electronic Equipment and Components
- /
- SZSE:300417
More Unpleasant Surprises Could Be In Store For Nanhua Instruments Co., Ltd.'s (SZSE:300417) Shares After Tumbling 32%

To the annoyance of some shareholders, Nanhua Instruments Co., Ltd. (SZSE:300417) shares are down a considerable 32% in the last month, which continues a horrid run for the company. The drop over the last 30 days has capped off a tough year for shareholders, with the share price down 42% in that time.
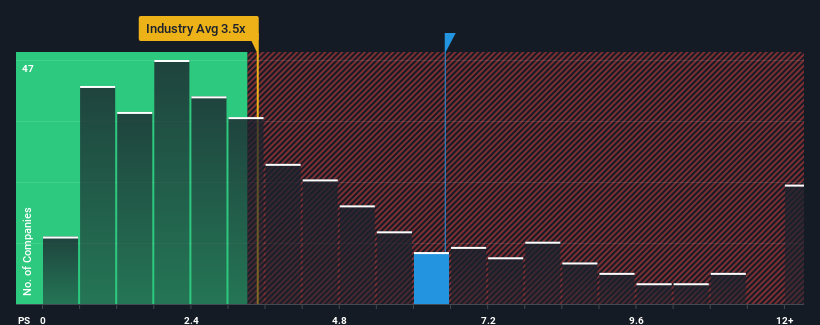
Even after such a large drop in price, given around half the companies in China's Electronic industry have price-to-sales ratios (or "P/S") below 3.5x, you may still consider Nanhua Instruments as a stock to avoid entirely with its 6.5x P/S ratio. Although, it's not wise to just take the P/S at face value as there may be an explanation why it's so lofty.
View our latest analysis for Nanhua Instruments
How Has Nanhua Instruments Performed Recently?
For instance, Nanhua Instruments' receding revenue in recent times would have to be some food for thought. Perhaps the market believes the company can do enough to outperform the rest of the industry in the near future, which is keeping the P/S ratio high. You'd really hope so, otherwise you're paying a pretty hefty price for no particular reason.
Want the full picture on earnings, revenue and cash flow for the company? Then our free report on Nanhua Instruments will help you shine a light on its historical performance.Do Revenue Forecasts Match The High P/S Ratio?
In order to justify its P/S ratio, Nanhua Instruments would need to produce outstanding growth that's well in excess of the industry.
Taking a look back first, the company's revenue growth last year wasn't something to get excited about as it posted a disappointing decline of 8.2%. This means it has also seen a slide in revenue over the longer-term as revenue is down 71% in total over the last three years. Accordingly, shareholders would have felt downbeat about the medium-term rates of revenue growth.
In contrast to the company, the rest of the industry is expected to grow by 23% over the next year, which really puts the company's recent medium-term revenue decline into perspective.
With this in mind, we find it worrying that Nanhua Instruments' P/S exceeds that of its industry peers. Apparently many investors in the company are way more bullish than recent times would indicate and aren't willing to let go of their stock at any price. There's a very good chance existing shareholders are setting themselves up for future disappointment if the P/S falls to levels more in line with the recent negative growth rates.
What Does Nanhua Instruments' P/S Mean For Investors?
Nanhua Instruments' shares may have suffered, but its P/S remains high. Generally, our preference is to limit the use of the price-to-sales ratio to establishing what the market thinks about the overall health of a company.
We've established that Nanhua Instruments currently trades on a much higher than expected P/S since its recent revenues have been in decline over the medium-term. Right now we aren't comfortable with the high P/S as this revenue performance is highly unlikely to support such positive sentiment for long. Should recent medium-term revenue trends persist, it would pose a significant risk to existing shareholders' investments and prospective investors will have a hard time accepting the current value of the stock.
Before you take the next step, you should know about the 2 warning signs for Nanhua Instruments that we have uncovered.
If you're unsure about the strength of Nanhua Instruments' business, why not explore our interactive list of stocks with solid business fundamentals for some other companies you may have missed.
Mobile Infrastructure for Defense and Disaster
The next wave in robotics isn't humanoid. Its fully autonomous towers delivering 5G, ISR, and radar in under 30 minutes, anywhere.
Get the investor briefing before the next round of contracts
Sponsored On Behalf of CiTechValuation is complex, but we're here to simplify it.
Discover if Nanhua Instruments might be undervalued or overvalued with our detailed analysis, featuring fair value estimates, potential risks, dividends, insider trades, and its financial condition.
Access Free AnalysisHave feedback on this article? Concerned about the content? Get in touch with us directly. Alternatively, email editorial-team (at) simplywallst.com.
This article by Simply Wall St is general in nature. We provide commentary based on historical data and analyst forecasts only using an unbiased methodology and our articles are not intended to be financial advice. It does not constitute a recommendation to buy or sell any stock, and does not take account of your objectives, or your financial situation. We aim to bring you long-term focused analysis driven by fundamental data. Note that our analysis may not factor in the latest price-sensitive company announcements or qualitative material. Simply Wall St has no position in any stocks mentioned.
About SZSE:300417
Nanhua Instruments
Manufactures and sells vehicle test equipment in China.
Mediocre balance sheet with minimal risk.
Market Insights

Weekly Picks

Early mover in a fast growing industry. Likely to experience share price volatility as they scale


A case for CA$31.80 (undiluted), aka 8,616% upside from CA$0.37 (an 86 bagger!).


Moderation and Stabilisation: HOLD: Fair Price based on a 4-year Cycle is $12.08
Recently Updated Narratives

Airbnb Stock: Platform Growth in a World of Saturation and Scrutiny

Adobe Stock: AI-Fueled ARR Growth Pushes Guidance Higher, But Cost Pressures Loom

Thomson Reuters Stock: When Legal Intelligence Becomes Mission-Critical Infrastructure
Popular Narratives


Crazy Undervalued 42 Baggers Silver Play (Active & Running Mine)


NVDA: Expanding AI Demand Will Drive Major Data Center Investments Through 2026

The AI Infrastructure Giant Grows Into Its Valuation
Trending Discussion


