- China
- /
- Electronic Equipment and Components
- /
- SZSE:300269
Shenzhen Liantronics Co.,Ltd's (SZSE:300269) Share Price Boosted 33% But Its Business Prospects Need A Lift Too

Shenzhen Liantronics Co.,Ltd (SZSE:300269) shareholders would be excited to see that the share price has had a great month, posting a 33% gain and recovering from prior weakness. Taking a wider view, although not as strong as the last month, the full year gain of 13% is also fairly reasonable.
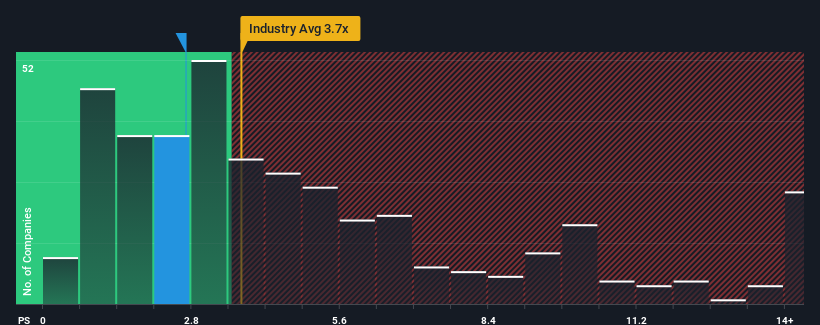
In spite of the firm bounce in price, Shenzhen LiantronicsLtd's price-to-sales (or "P/S") ratio of 2.7x might still make it look like a buy right now compared to the Electronic industry in China, where around half of the companies have P/S ratios above 3.7x and even P/S above 7x are quite common. However, the P/S might be low for a reason and it requires further investigation to determine if it's justified.
View our latest analysis for Shenzhen LiantronicsLtd
What Does Shenzhen LiantronicsLtd's P/S Mean For Shareholders?
For instance, Shenzhen LiantronicsLtd's receding revenue in recent times would have to be some food for thought. Perhaps the market believes the recent revenue performance isn't good enough to keep up the industry, causing the P/S ratio to suffer. Those who are bullish on Shenzhen LiantronicsLtd will be hoping that this isn't the case so that they can pick up the stock at a lower valuation.
Want the full picture on earnings, revenue and cash flow for the company? Then our free report on Shenzhen LiantronicsLtd will help you shine a light on its historical performance.Is There Any Revenue Growth Forecasted For Shenzhen LiantronicsLtd?
In order to justify its P/S ratio, Shenzhen LiantronicsLtd would need to produce sluggish growth that's trailing the industry.
In reviewing the last year of financials, we were disheartened to see the company's revenues fell to the tune of 18%. This means it has also seen a slide in revenue over the longer-term as revenue is down 31% in total over the last three years. So unfortunately, we have to acknowledge that the company has not done a great job of growing revenue over that time.
Comparing that to the industry, which is predicted to deliver 25% growth in the next 12 months, the company's downward momentum based on recent medium-term revenue results is a sobering picture.
With this in mind, we understand why Shenzhen LiantronicsLtd's P/S is lower than most of its industry peers. Nonetheless, there's no guarantee the P/S has reached a floor yet with revenue going in reverse. Even just maintaining these prices could be difficult to achieve as recent revenue trends are already weighing down the shares.
What We Can Learn From Shenzhen LiantronicsLtd's P/S?
The latest share price surge wasn't enough to lift Shenzhen LiantronicsLtd's P/S close to the industry median. Using the price-to-sales ratio alone to determine if you should sell your stock isn't sensible, however it can be a practical guide to the company's future prospects.
As we suspected, our examination of Shenzhen LiantronicsLtd revealed its shrinking revenue over the medium-term is contributing to its low P/S, given the industry is set to grow. Right now shareholders are accepting the low P/S as they concede future revenue probably won't provide any pleasant surprises either. Given the current circumstances, it seems unlikely that the share price will experience any significant movement in either direction in the near future if recent medium-term revenue trends persist.
Before you settle on your opinion, we've discovered 1 warning sign for Shenzhen LiantronicsLtd that you should be aware of.
It's important to make sure you look for a great company, not just the first idea you come across. So if growing profitability aligns with your idea of a great company, take a peek at this free list of interesting companies with strong recent earnings growth (and a low P/E).
Mobile Infrastructure for Defense and Disaster
The next wave in robotics isn't humanoid. Its fully autonomous towers delivering 5G, ISR, and radar in under 30 minutes, anywhere.
Get the investor briefing before the next round of contracts
Sponsored On Behalf of CiTechNew: Manage All Your Stock Portfolios in One Place
We've created the ultimate portfolio companion for stock investors, and it's free.
• Connect an unlimited number of Portfolios and see your total in one currency
• Be alerted to new Warning Signs or Risks via email or mobile
• Track the Fair Value of your stocks
Have feedback on this article? Concerned about the content? Get in touch with us directly. Alternatively, email editorial-team (at) simplywallst.com.
This article by Simply Wall St is general in nature. We provide commentary based on historical data and analyst forecasts only using an unbiased methodology and our articles are not intended to be financial advice. It does not constitute a recommendation to buy or sell any stock, and does not take account of your objectives, or your financial situation. We aim to bring you long-term focused analysis driven by fundamental data. Note that our analysis may not factor in the latest price-sensitive company announcements or qualitative material. Simply Wall St has no position in any stocks mentioned.
About SZSE:300269
Adequate balance sheet with acceptable track record.
Market Insights

Weekly Picks

Early mover in a fast growing industry. Likely to experience share price volatility as they scale


A case for CA$31.80 (undiluted), aka 8,616% upside from CA$0.37 (an 86 bagger!).


Moderation and Stabilisation: HOLD: Fair Price based on a 4-year Cycle is $12.08
Recently Updated Narratives

Airbnb Stock: Platform Growth in a World of Saturation and Scrutiny

Adobe Stock: AI-Fueled ARR Growth Pushes Guidance Higher, But Cost Pressures Loom

Thomson Reuters Stock: When Legal Intelligence Becomes Mission-Critical Infrastructure
Popular Narratives


Crazy Undervalued 42 Baggers Silver Play (Active & Running Mine)


NVDA: Expanding AI Demand Will Drive Major Data Center Investments Through 2026

The AI Infrastructure Giant Grows Into Its Valuation
Trending Discussion


