
Advertisement
- China
- /
- Communications
- /
- SZSE:300167
Little Excitement Around Shenzhen Division Co.,Ltd.'s (SZSE:300167) Revenues As Shares Take 39% Pounding
Unfortunately for some shareholders, the Shenzhen Division Co.,Ltd. (SZSE:300167) share price has dived 39% in the last thirty days, prolonging recent pain. For any long-term shareholders, the last month ends a year to forget by locking in a 72% share price decline.
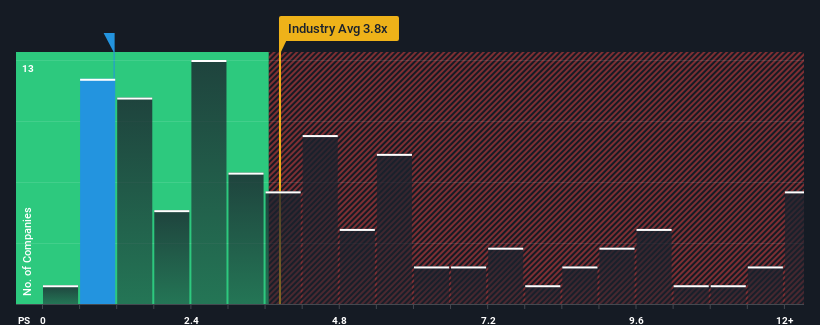
Following the heavy fall in price, Shenzhen DivisionLtd's price-to-sales (or "P/S") ratio of 1.1x might make it look like a strong buy right now compared to the wider Communications industry in China, where around half of the companies have P/S ratios above 3.8x and even P/S above 7x are quite common. However, the P/S might be quite low for a reason and it requires further investigation to determine if it's justified.
Check out our latest analysis for Shenzhen DivisionLtd
What Does Shenzhen DivisionLtd's P/S Mean For Shareholders?
For example, consider that Shenzhen DivisionLtd's financial performance has been poor lately as its revenue has been in decline. One possibility is that the P/S is low because investors think the company won't do enough to avoid underperforming the broader industry in the near future. If you like the company, you'd be hoping this isn't the case so that you could potentially pick up some stock while it's out of favour.
Although there are no analyst estimates available for Shenzhen DivisionLtd, take a look at this free data-rich visualisation to see how the company stacks up on earnings, revenue and cash flow.Do Revenue Forecasts Match The Low P/S Ratio?
In order to justify its P/S ratio, Shenzhen DivisionLtd would need to produce anemic growth that's substantially trailing the industry.
Retrospectively, the last year delivered a frustrating 11% decrease to the company's top line. This has erased any of its gains during the last three years, with practically no change in revenue being achieved in total. Therefore, it's fair to say that revenue growth has been inconsistent recently for the company.
Comparing that to the industry, which is predicted to deliver 50% growth in the next 12 months, the company's momentum is weaker, based on recent medium-term annualised revenue results.
With this in consideration, it's easy to understand why Shenzhen DivisionLtd's P/S falls short of the mark set by its industry peers. It seems most investors are expecting to see the recent limited growth rates continue into the future and are only willing to pay a reduced amount for the stock.
The Key Takeaway
Shenzhen DivisionLtd's P/S looks about as weak as its stock price lately. We'd say the price-to-sales ratio's power isn't primarily as a valuation instrument but rather to gauge current investor sentiment and future expectations.
Our examination of Shenzhen DivisionLtd confirms that the company's revenue trends over the past three-year years are a key factor in its low price-to-sales ratio, as we suspected, given they fall short of current industry expectations. At this stage investors feel the potential for an improvement in revenue isn't great enough to justify a higher P/S ratio. If recent medium-term revenue trends continue, it's hard to see the share price experience a reversal of fortunes anytime soon.
Before you settle on your opinion, we've discovered 4 warning signs for Shenzhen DivisionLtd (2 make us uncomfortable!) that you should be aware of.
It's important to make sure you look for a great company, not just the first idea you come across. So if growing profitability aligns with your idea of a great company, take a peek at this free list of interesting companies with strong recent earnings growth (and a low P/E).
New: Manage All Your Stock Portfolios in One Place
We've created the ultimate portfolio companion for stock investors, and it's free.
• Connect an unlimited number of Portfolios and see your total in one currency
• Be alerted to new Warning Signs or Risks via email or mobile
• Track the Fair Value of your stocks
Have feedback on this article? Concerned about the content? Get in touch with us directly. Alternatively, email editorial-team (at) simplywallst.com.
This article by Simply Wall St is general in nature. We provide commentary based on historical data and analyst forecasts only using an unbiased methodology and our articles are not intended to be financial advice. It does not constitute a recommendation to buy or sell any stock, and does not take account of your objectives, or your financial situation. We aim to bring you long-term focused analysis driven by fundamental data. Note that our analysis may not factor in the latest price-sensitive company announcements or qualitative material. Simply Wall St has no position in any stocks mentioned.
About SZSE:300167
Shenzhen DivisionLtd
Engages in the research and development, and sale of smart video and IoT core technology products and solutions primarily in China.
Mediocre balance sheet and slightly overvalued.
Market Insights

Advertisement
Community Narratives
The company that turned a verb into a global necessity and basically runs the modern internet, digital ads, smartphones, maps, and AI.
Fair Value US$300.00|10.2% undervalued
OS
Community Contributor
Flowers Foods Pays A Fair Price For Health
Fair Value US$16.12|20.3% undervalued
NV
Community Contributor
TMX Group will thrive with 33.3% profit margin and enduring market moat
Fair Value CA$49.90|0.1% undervalued
LI
Community Contributor