- China
- /
- Electronic Equipment and Components
- /
- SZSE:300120
Tianjin Jingwei Huikai Optoelectronic Co., Ltd. (SZSE:300120) Stock Catapults 32% Though Its Price And Business Still Lag The Industry
Tianjin Jingwei Huikai Optoelectronic Co., Ltd. (SZSE:300120) shares have had a really impressive month, gaining 32% after a shaky period beforehand. Not all shareholders will be feeling jubilant, since the share price is still down a very disappointing 14% in the last twelve months.
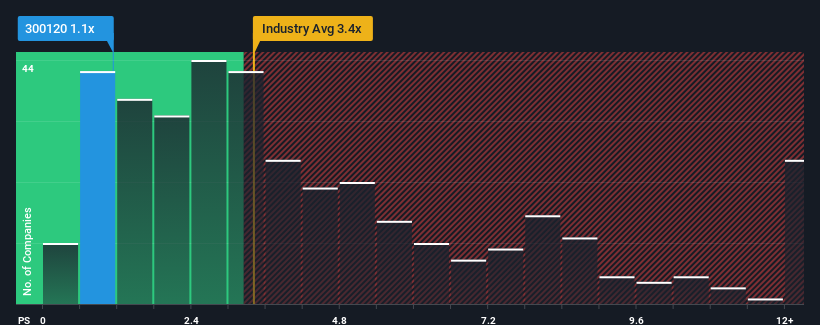
Although its price has surged higher, Tianjin Jingwei Huikai Optoelectronic may still look like a strong buying opportunity at present with its price-to-sales (or "P/S") ratio of 1.1x, considering almost half of all companies in the Electronic industry in China have P/S ratios greater than 3.4x and even P/S higher than 7x aren't out of the ordinary. Nonetheless, we'd need to dig a little deeper to determine if there is a rational basis for the highly reduced P/S.
View our latest analysis for Tianjin Jingwei Huikai Optoelectronic

How Has Tianjin Jingwei Huikai Optoelectronic Performed Recently?
Revenue has risen firmly for Tianjin Jingwei Huikai Optoelectronic recently, which is pleasing to see. One possibility is that the P/S is low because investors think this respectable revenue growth might actually underperform the broader industry in the near future. Those who are bullish on Tianjin Jingwei Huikai Optoelectronic will be hoping that this isn't the case, so that they can pick up the stock at a lower valuation.
We don't have analyst forecasts, but you can see how recent trends are setting up the company for the future by checking out our free report on Tianjin Jingwei Huikai Optoelectronic's earnings, revenue and cash flow.What Are Revenue Growth Metrics Telling Us About The Low P/S?
Tianjin Jingwei Huikai Optoelectronic's P/S ratio would be typical for a company that's expected to deliver very poor growth or even falling revenue, and importantly, perform much worse than the industry.
Retrospectively, the last year delivered an exceptional 16% gain to the company's top line. Although, its longer-term performance hasn't been as strong with three-year revenue growth being relatively non-existent overall. So it appears to us that the company has had a mixed result in terms of growing revenue over that time.
Comparing the recent medium-term revenue trends against the industry's one-year growth forecast of 25% shows it's noticeably less attractive.
With this in consideration, it's easy to understand why Tianjin Jingwei Huikai Optoelectronic's P/S falls short of the mark set by its industry peers. It seems most investors are expecting to see the recent limited growth rates continue into the future and are only willing to pay a reduced amount for the stock.
The Final Word
Even after such a strong price move, Tianjin Jingwei Huikai Optoelectronic's P/S still trails the rest of the industry. It's argued the price-to-sales ratio is an inferior measure of value within certain industries, but it can be a powerful business sentiment indicator.
Our examination of Tianjin Jingwei Huikai Optoelectronic confirms that the company's revenue trends over the past three-year years are a key factor in its low price-to-sales ratio, as we suspected, given they fall short of current industry expectations. Right now shareholders are accepting the low P/S as they concede future revenue probably won't provide any pleasant surprises. Unless the recent medium-term conditions improve, they will continue to form a barrier for the share price around these levels.
It is also worth noting that we have found 2 warning signs for Tianjin Jingwei Huikai Optoelectronic that you need to take into consideration.
If strong companies turning a profit tickle your fancy, then you'll want to check out this free list of interesting companies that trade on a low P/E (but have proven they can grow earnings).
Valuation is complex, but we're here to simplify it.
Discover if Tianjin Jingwei Huikai Optoelectronic might be undervalued or overvalued with our detailed analysis, featuring fair value estimates, potential risks, dividends, insider trades, and its financial condition.
Access Free AnalysisHave feedback on this article? Concerned about the content? Get in touch with us directly. Alternatively, email editorial-team (at) simplywallst.com.
This article by Simply Wall St is general in nature. We provide commentary based on historical data and analyst forecasts only using an unbiased methodology and our articles are not intended to be financial advice. It does not constitute a recommendation to buy or sell any stock, and does not take account of your objectives, or your financial situation. We aim to bring you long-term focused analysis driven by fundamental data. Note that our analysis may not factor in the latest price-sensitive company announcements or qualitative material. Simply Wall St has no position in any stocks mentioned.
Have feedback on this article? Concerned about the content? Get in touch with us directly. Alternatively, email editorial-team@simplywallst.com
About SZSE:300120
Tianjin Jingwei Huikai Optoelectronic
Tianjin Jingwei Huikai Optoelectronic Co., Ltd.
Excellent balance sheet and slightly overvalued.
Market Insights
Community Narratives


