
Advertisement
- China
- /
- Electronic Equipment and Components
- /
- SZSE:002876
Shenzhen Sunnypol Optoelectronics Co.,Ltd. (SZSE:002876) Stock Rockets 37% But Many Are Still Ignoring The Company
Despite an already strong run, Shenzhen Sunnypol Optoelectronics Co.,Ltd. (SZSE:002876) shares have been powering on, with a gain of 37% in the last thirty days. But the gains over the last month weren't enough to make shareholders whole, as the share price is still down 8.0% in the last twelve months.
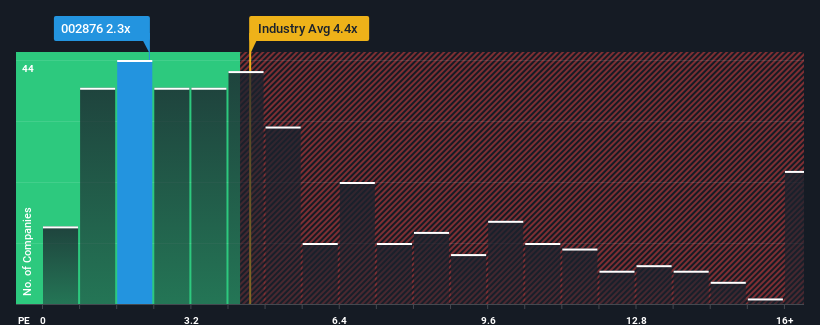
Even after such a large jump in price, Shenzhen Sunnypol OptoelectronicsLtd may still be sending buy signals at present with its price-to-sales (or "P/S") ratio of 2.3x, considering almost half of all companies in the Electronic industry in China have P/S ratios greater than 4.4x and even P/S higher than 9x aren't out of the ordinary. However, the P/S might be low for a reason and it requires further investigation to determine if it's justified.
View our latest analysis for Shenzhen Sunnypol OptoelectronicsLtd
How Has Shenzhen Sunnypol OptoelectronicsLtd Performed Recently?
Shenzhen Sunnypol OptoelectronicsLtd certainly has been doing a good job lately as it's been growing revenue more than most other companies. It might be that many expect the strong revenue performance to degrade substantially, which has repressed the share price, and thus the P/S ratio. If you like the company, you'd be hoping this isn't the case so that you could potentially pick up some stock while it's out of favour.
Want the full picture on analyst estimates for the company? Then our free report on Shenzhen Sunnypol OptoelectronicsLtd will help you uncover what's on the horizon.What Are Revenue Growth Metrics Telling Us About The Low P/S?
There's an inherent assumption that a company should underperform the industry for P/S ratios like Shenzhen Sunnypol OptoelectronicsLtd's to be considered reasonable.
If we review the last year of revenue growth, the company posted a terrific increase of 17%. Although, its longer-term performance hasn't been as strong with three-year revenue growth being relatively non-existent overall. Therefore, it's fair to say that revenue growth has been inconsistent recently for the company.
Looking ahead now, revenue is anticipated to climb by 63% during the coming year according to the only analyst following the company. Meanwhile, the rest of the industry is forecast to only expand by 27%, which is noticeably less attractive.
With this information, we find it odd that Shenzhen Sunnypol OptoelectronicsLtd is trading at a P/S lower than the industry. Apparently some shareholders are doubtful of the forecasts and have been accepting significantly lower selling prices.
The Key Takeaway
Despite Shenzhen Sunnypol OptoelectronicsLtd's share price climbing recently, its P/S still lags most other companies. Using the price-to-sales ratio alone to determine if you should sell your stock isn't sensible, however it can be a practical guide to the company's future prospects.
To us, it seems Shenzhen Sunnypol OptoelectronicsLtd currently trades on a significantly depressed P/S given its forecasted revenue growth is higher than the rest of its industry. There could be some major risk factors that are placing downward pressure on the P/S ratio. At least price risks look to be very low, but investors seem to think future revenues could see a lot of volatility.
We don't want to rain on the parade too much, but we did also find 3 warning signs for Shenzhen Sunnypol OptoelectronicsLtd (1 is concerning!) that you need to be mindful of.
It's important to make sure you look for a great company, not just the first idea you come across. So if growing profitability aligns with your idea of a great company, take a peek at this free list of interesting companies with strong recent earnings growth (and a low P/E).
New: Manage All Your Stock Portfolios in One Place
We've created the ultimate portfolio companion for stock investors, and it's free.
• Connect an unlimited number of Portfolios and see your total in one currency
• Be alerted to new Warning Signs or Risks via email or mobile
• Track the Fair Value of your stocks
Have feedback on this article? Concerned about the content? Get in touch with us directly. Alternatively, email editorial-team (at) simplywallst.com.
This article by Simply Wall St is general in nature. We provide commentary based on historical data and analyst forecasts only using an unbiased methodology and our articles are not intended to be financial advice. It does not constitute a recommendation to buy or sell any stock, and does not take account of your objectives, or your financial situation. We aim to bring you long-term focused analysis driven by fundamental data. Note that our analysis may not factor in the latest price-sensitive company announcements or qualitative material. Simply Wall St has no position in any stocks mentioned.
About SZSE:002876
Shenzhen Sunnypol OptoelectronicsLtd
Shenzhen Sunnypol Optoelectronics Co.,Ltd.
High growth potential with low risk.
Market Insights

Advertisement
Weekly Picks
FA

FAI on Arabian Internet and Communication Services ·
Solutions by stc: 34% Upside in Saudi's Digital Transformation Leader
Fair Value:ر.س342.2335.5% undervalued
10 followersusers have followed this narrative
1 commentusers have commented on this narrative
4 likesusers have liked this narrative
RO


RobertoAllende on NVIDIA ·
The AI Infrastructure Giant Grows Into Its Valuation
Fair Value:US$345.0747.9% undervalued
28 followersusers have followed this narrative
28 commentsusers have commented on this narrative
21 likesusers have liked this narrative
Recently Updated Narratives
TA

Talos on NVIDIA ·
Not a Bubble, But the "Industrial Revolution 4.0" Engine
Fair Value:US$294.9239.0% undervalued
1 followerusers have followed this narrative
0 commentsusers have commented on this narrative
0 likesusers have liked this narrative
TA

Talos on Advanced Micro Devices ·
The "David vs. Goliath" AI Trade – Why Second Place is Worth Billions
Fair Value:US$416.4647.2% undervalued
2 followersusers have followed this narrative
0 commentsusers have commented on this narrative
0 likesusers have liked this narrative
TA

Talos on PayPal Holdings ·
The "Sleeping Giant" Wakes Up – Efficiency & Monetization
Fair Value:US$174.9264.2% undervalued
5 followersusers have followed this narrative
0 commentsusers have commented on this narrative
0 likesusers have liked this narrative
Popular Narratives
TH


TheWallstreetKing on MicroVision ·
MicroVision will explode future revenue by 380.37% with a vision towards success
Fair Value:US$6098.6% undervalued
111 followersusers have followed this narrative
11 commentsusers have commented on this narrative
22 likesusers have liked this narrative
AN

AnalystConsensusTarget on NVIDIA ·
NVDA: Expanding AI Demand Will Drive Major Data Center Investments Through 2026
Fair Value:US$250.3928.1% undervalued
945 followersusers have followed this narrative
6 commentsusers have commented on this narrative
24 likesusers have liked this narrative
OS


oscargarcia on Alphabet ·
The company that turned a verb into a global necessity and basically runs the modern internet, digital ads, smartphones, maps, and AI.
Fair Value:US$3407.4% undervalued
147 followersusers have followed this narrative
6 commentsusers have commented on this narrative
18 likesusers have liked this narrative