- China
- /
- Electronic Equipment and Components
- /
- SZSE:002587
Some Confidence Is Lacking In Shenzhen AOTO Electronics Co., Ltd. (SZSE:002587) As Shares Slide 27%
Shenzhen AOTO Electronics Co., Ltd. (SZSE:002587) shares have had a horrible month, losing 27% after a relatively good period beforehand. Longer-term shareholders would now have taken a real hit with the stock declining 5.0% in the last year.
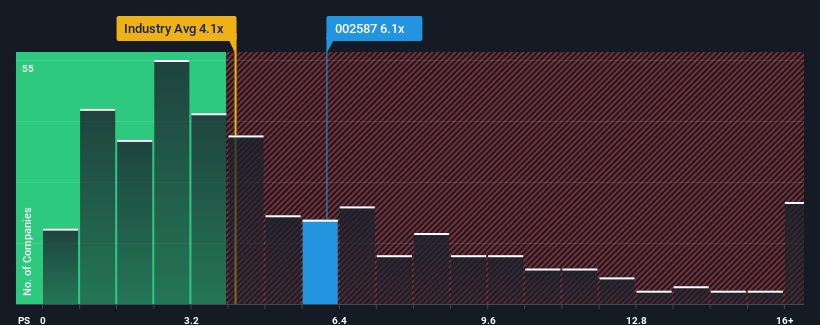
Even after such a large drop in price, Shenzhen AOTO Electronics' price-to-sales (or "P/S") ratio of 6.1x might still make it look like a sell right now compared to the wider Electronic industry in China, where around half of the companies have P/S ratios below 4.1x and even P/S below 2x are quite common. However, the P/S might be high for a reason and it requires further investigation to determine if it's justified.
Check out our latest analysis for Shenzhen AOTO Electronics

How Shenzhen AOTO Electronics Has Been Performing
As an illustration, revenue has deteriorated at Shenzhen AOTO Electronics over the last year, which is not ideal at all. One possibility is that the P/S is high because investors think the company will still do enough to outperform the broader industry in the near future. You'd really hope so, otherwise you're paying a pretty hefty price for no particular reason.
Want the full picture on earnings, revenue and cash flow for the company? Then our free report on Shenzhen AOTO Electronics will help you shine a light on its historical performance.What Are Revenue Growth Metrics Telling Us About The High P/S?
The only time you'd be truly comfortable seeing a P/S as high as Shenzhen AOTO Electronics' is when the company's growth is on track to outshine the industry.
In reviewing the last year of financials, we were disheartened to see the company's revenues fell to the tune of 17%. The last three years don't look nice either as the company has shrunk revenue by 18% in aggregate. Therefore, it's fair to say the revenue growth recently has been undesirable for the company.
Weighing that medium-term revenue trajectory against the broader industry's one-year forecast for expansion of 26% shows it's an unpleasant look.
With this in mind, we find it worrying that Shenzhen AOTO Electronics' P/S exceeds that of its industry peers. Apparently many investors in the company are way more bullish than recent times would indicate and aren't willing to let go of their stock at any price. There's a very good chance existing shareholders are setting themselves up for future disappointment if the P/S falls to levels more in line with the recent negative growth rates.
What Does Shenzhen AOTO Electronics' P/S Mean For Investors?
There's still some elevation in Shenzhen AOTO Electronics' P/S, even if the same can't be said for its share price recently. Typically, we'd caution against reading too much into price-to-sales ratios when settling on investment decisions, though it can reveal plenty about what other market participants think about the company.
We've established that Shenzhen AOTO Electronics currently trades on a much higher than expected P/S since its recent revenues have been in decline over the medium-term. With a revenue decline on investors' minds, the likelihood of a souring sentiment is quite high which could send the P/S back in line with what we'd expect. Unless the the circumstances surrounding the recent medium-term improve, it wouldn't be wrong to expect a a difficult period ahead for the company's shareholders.
You should always think about risks. Case in point, we've spotted 3 warning signs for Shenzhen AOTO Electronics you should be aware of, and 2 of them make us uncomfortable.
If companies with solid past earnings growth is up your alley, you may wish to see this free collection of other companies with strong earnings growth and low P/E ratios.
New: Manage All Your Stock Portfolios in One Place
We've created the ultimate portfolio companion for stock investors, and it's free.
• Connect an unlimited number of Portfolios and see your total in one currency
• Be alerted to new Warning Signs or Risks via email or mobile
• Track the Fair Value of your stocks
Have feedback on this article? Concerned about the content? Get in touch with us directly. Alternatively, email editorial-team (at) simplywallst.com.
This article by Simply Wall St is general in nature. We provide commentary based on historical data and analyst forecasts only using an unbiased methodology and our articles are not intended to be financial advice. It does not constitute a recommendation to buy or sell any stock, and does not take account of your objectives, or your financial situation. We aim to bring you long-term focused analysis driven by fundamental data. Note that our analysis may not factor in the latest price-sensitive company announcements or qualitative material. Simply Wall St has no position in any stocks mentioned.
About SZSE:002587
Shenzhen AOTO Electronics
Provides intelligent video solutions in China and internationally.
Adequate balance sheet and overvalued.
Similar Companies
Market Insights
Community Narratives


Recently Updated Narratives


Engineered for Stability. Positioned for Growth.


MINISO's fair value is projected at 26.69 with an anticipated PE ratio shift of 20x


Fiverr International will transform the freelance industry with AI-powered growth
Popular Narratives


MicroVision will explode future revenue by 380.37% with a vision towards success


NVDA: Expanding AI Demand Will Drive Major Data Center Investments Through 2026


