
Advertisement
- China
- /
- Electronic Equipment and Components
- /
- SZSE:002512
Tatwah Smartech Co.,Ltd.'s (SZSE:002512) Shares Bounce 25% But Its Business Still Trails The Industry
Tatwah Smartech Co.,Ltd. (SZSE:002512) shareholders are no doubt pleased to see that the share price has bounced 25% in the last month, although it is still struggling to make up recently lost ground. Notwithstanding the latest gain, the annual share price return of 5.1% isn't as impressive.
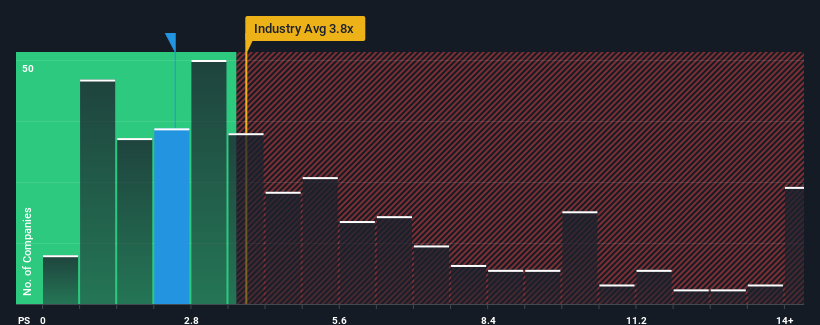
Even after such a large jump in price, Tatwah SmartechLtd's price-to-sales (or "P/S") ratio of 2.5x might still make it look like a buy right now compared to the Electronic industry in China, where around half of the companies have P/S ratios above 3.8x and even P/S above 7x are quite common. However, the P/S might be low for a reason and it requires further investigation to determine if it's justified.
View our latest analysis for Tatwah SmartechLtd
How Tatwah SmartechLtd Has Been Performing
Recent times have been quite advantageous for Tatwah SmartechLtd as its revenue has been rising very briskly. Perhaps the market is expecting future revenue performance to dwindle, which has kept the P/S suppressed. Those who are bullish on Tatwah SmartechLtd will be hoping that this isn't the case, so that they can pick up the stock at a lower valuation.
Want the full picture on earnings, revenue and cash flow for the company? Then our free report on Tatwah SmartechLtd will help you shine a light on its historical performance.What Are Revenue Growth Metrics Telling Us About The Low P/S?
Tatwah SmartechLtd's P/S ratio would be typical for a company that's only expected to deliver limited growth, and importantly, perform worse than the industry.
Retrospectively, the last year delivered an exceptional 35% gain to the company's top line. Still, revenue has fallen 22% in total from three years ago, which is quite disappointing. So unfortunately, we have to acknowledge that the company has not done a great job of growing revenues over that time.
Weighing that medium-term revenue trajectory against the broader industry's one-year forecast for expansion of 26% shows it's an unpleasant look.
With this in mind, we understand why Tatwah SmartechLtd's P/S is lower than most of its industry peers. Nonetheless, there's no guarantee the P/S has reached a floor yet with revenue going in reverse. Even just maintaining these prices could be difficult to achieve as recent revenue trends are already weighing down the shares.
What Does Tatwah SmartechLtd's P/S Mean For Investors?
The latest share price surge wasn't enough to lift Tatwah SmartechLtd's P/S close to the industry median. Using the price-to-sales ratio alone to determine if you should sell your stock isn't sensible, however it can be a practical guide to the company's future prospects.
It's no surprise that Tatwah SmartechLtd maintains its low P/S off the back of its sliding revenue over the medium-term. Right now shareholders are accepting the low P/S as they concede future revenue probably won't provide any pleasant surprises either. Given the current circumstances, it seems unlikely that the share price will experience any significant movement in either direction in the near future if recent medium-term revenue trends persist.
It is also worth noting that we have found 2 warning signs for Tatwah SmartechLtd (1 shouldn't be ignored!) that you need to take into consideration.
If these risks are making you reconsider your opinion on Tatwah SmartechLtd, explore our interactive list of high quality stocks to get an idea of what else is out there.
Valuation is complex, but we're here to simplify it.
Discover if Tatwah SmartechLtd might be undervalued or overvalued with our detailed analysis, featuring fair value estimates, potential risks, dividends, insider trades, and its financial condition.
Access Free AnalysisHave feedback on this article? Concerned about the content? Get in touch with us directly. Alternatively, email editorial-team (at) simplywallst.com.
This article by Simply Wall St is general in nature. We provide commentary based on historical data and analyst forecasts only using an unbiased methodology and our articles are not intended to be financial advice. It does not constitute a recommendation to buy or sell any stock, and does not take account of your objectives, or your financial situation. We aim to bring you long-term focused analysis driven by fundamental data. Note that our analysis may not factor in the latest price-sensitive company announcements or qualitative material. Simply Wall St has no position in any stocks mentioned.
About SZSE:002512
Tatwah SmartechLtd
Provides communication networks, digital screens, and digital application services in China and internationally.
Adequate balance sheet and slightly overvalued.
Market Insights

Advertisement
Weekly Picks
FA

FAI on Arabian Internet and Communication Services ·
Solutions by stc: 34% Upside in Saudi's Digital Transformation Leader
Fair Value:ر.س342.2335.3% undervalued
8 followersusers have followed this narrative
1 commentusers have commented on this narrative
3 likesusers have liked this narrative
RO


RobertoAllende on NVIDIA ·
The AI Infrastructure Giant Grows Into Its Valuation
Fair Value:US$345.0747.9% undervalued
27 followersusers have followed this narrative
28 commentsusers have commented on this narrative
21 likesusers have liked this narrative
Recently Updated Narratives
AB
Abc on Global X Etfs Icav - Global X Silver Miners Ucits ETF ·
Many trends acting at the same time
Fair Value:€10068.5% undervalued
1 followerusers have followed this narrative
0 commentsusers have commented on this narrative
0 likesusers have liked this narrative
NI


niteco on Texas Instruments ·
Engineered for Stability. Positioned for Growth.
Fair Value:US$314.4446.5% undervalued
1 followerusers have followed this narrative
0 commentsusers have commented on this narrative
0 likesusers have liked this narrative
MA


MarkoVT on Applied Digital ·
Staggered by dilution; positions for growth
Fair Value:US$35.4520.4% undervalued
1 followerusers have followed this narrative
0 commentsusers have commented on this narrative
0 likesusers have liked this narrative
Popular Narratives
TH

TheWallstreetKing on MicroVision ·
MicroVision will explode future revenue by 380.37% with a vision towards success
Fair Value:US$6098.4% undervalued
109 followersusers have followed this narrative
11 commentsusers have commented on this narrative
22 likesusers have liked this narrative
AN

AnalystConsensusTarget on NVIDIA ·
NVDA: Expanding AI Demand Will Drive Major Data Center Investments Through 2026
Fair Value:US$250.3928.1% undervalued
939 followersusers have followed this narrative
6 commentsusers have commented on this narrative
24 likesusers have liked this narrative
OS


oscargarcia on Alphabet ·
The company that turned a verb into a global necessity and basically runs the modern internet, digital ads, smartphones, maps, and AI.
Fair Value:US$3407.4% undervalued
145 followersusers have followed this narrative
6 commentsusers have commented on this narrative
18 likesusers have liked this narrative