
Advertisement
- China
- /
- Electronic Equipment and Components
- /
- SZSE:002387
Visionox Technology Inc. (SZSE:002387) Shares Fly 25% But Investors Aren't Buying For Growth
Visionox Technology Inc. (SZSE:002387) shareholders are no doubt pleased to see that the share price has bounced 25% in the last month, although it is still struggling to make up recently lost ground. The last 30 days bring the annual gain to a very sharp 35%.
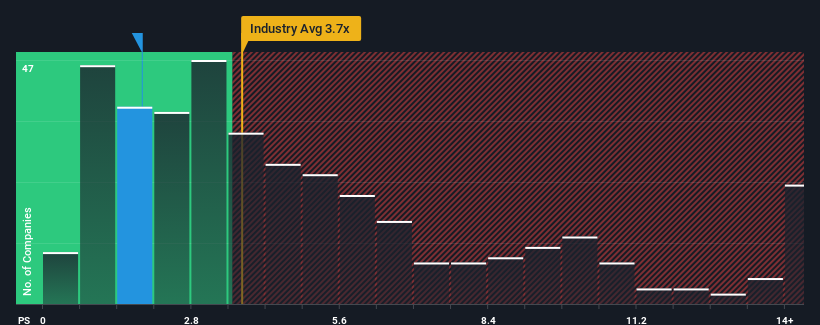
Even after such a large jump in price, Visionox Technology may still be sending bullish signals at the moment with its price-to-sales (or "P/S") ratio of 1.9x, since almost half of all companies in the Electronic industry in China have P/S ratios greater than 3.7x and even P/S higher than 7x are not unusual. Nonetheless, we'd need to dig a little deeper to determine if there is a rational basis for the reduced P/S.
View our latest analysis for Visionox Technology
How Visionox Technology Has Been Performing
Visionox Technology hasn't been tracking well recently as its declining revenue compares poorly to other companies, which have seen some growth in their revenues on average. It seems that many are expecting the poor revenue performance to persist, which has repressed the P/S ratio. If this is the case, then existing shareholders will probably struggle to get excited about the future direction of the share price.
Keen to find out how analysts think Visionox Technology's future stacks up against the industry? In that case, our free report is a great place to start.What Are Revenue Growth Metrics Telling Us About The Low P/S?
Visionox Technology's P/S ratio would be typical for a company that's only expected to deliver limited growth, and importantly, perform worse than the industry.
Taking a look back first, we see that there was hardly any revenue growth to speak of for the company over the past year. However, a few strong years before that means that it was still able to grow revenue by an impressive 140% in total over the last three years. Accordingly, shareholders will be pleased, but also have some questions to ponder about the last 12 months.
Looking ahead now, revenue is anticipated to climb by 12% during the coming year according to the only analyst following the company. That's shaping up to be materially lower than the 26% growth forecast for the broader industry.
In light of this, it's understandable that Visionox Technology's P/S sits below the majority of other companies. It seems most investors are expecting to see limited future growth and are only willing to pay a reduced amount for the stock.
What Does Visionox Technology's P/S Mean For Investors?
Despite Visionox Technology's share price climbing recently, its P/S still lags most other companies. It's argued the price-to-sales ratio is an inferior measure of value within certain industries, but it can be a powerful business sentiment indicator.
We've established that Visionox Technology maintains its low P/S on the weakness of its forecast growth being lower than the wider industry, as expected. At this stage investors feel the potential for an improvement in revenue isn't great enough to justify a higher P/S ratio. The company will need a change of fortune to justify the P/S rising higher in the future.
We don't want to rain on the parade too much, but we did also find 1 warning sign for Visionox Technology that you need to be mindful of.
If you're unsure about the strength of Visionox Technology's business, why not explore our interactive list of stocks with solid business fundamentals for some other companies you may have missed.
New: Manage All Your Stock Portfolios in One Place
We've created the ultimate portfolio companion for stock investors, and it's free.
• Connect an unlimited number of Portfolios and see your total in one currency
• Be alerted to new Warning Signs or Risks via email or mobile
• Track the Fair Value of your stocks
Have feedback on this article? Concerned about the content? Get in touch with us directly. Alternatively, email editorial-team (at) simplywallst.com.
This article by Simply Wall St is general in nature. We provide commentary based on historical data and analyst forecasts only using an unbiased methodology and our articles are not intended to be financial advice. It does not constitute a recommendation to buy or sell any stock, and does not take account of your objectives, or your financial situation. We aim to bring you long-term focused analysis driven by fundamental data. Note that our analysis may not factor in the latest price-sensitive company announcements or qualitative material. Simply Wall St has no position in any stocks mentioned.
About SZSE:002387
Visionox Technology
Researches, develops, manufactures, markets, and sells organic light-emitting display products worldwide.
Mediocre balance sheet and slightly overvalued.
Market Insights

Advertisement
Community Narratives
Finding The True Value Of A Logistics Powerhouse
Fair Value US$95.21|8.4% undervalued
NV
Community Contributor
Paradigm Biopharmaceuticals Will Lead Osteoarthritis Treatment with Zilosul's FDA Success
Fair Value AU$5.50|91.9% undervalued
AM
Community Contributor
Barrick Mining (ABX:CA): A Gold Hedge against a U.S. Shutdown
Fair Value CA$60.00|25.8% undervalued
GM
Community Contributor