
Advertisement
- China
- /
- Electronic Equipment and Components
- /
- SZSE:001287
Why Shenzhen CECport Technologies' (SZSE:001287) Shaky Earnings Are Just The Beginning Of Its Problems
Shenzhen CECport Technologies Co., Ltd.'s (SZSE:001287) recent weak earnings report didn't cause a big stock movement. Our analysis suggests that along with soft profit numbers, investors should be aware of some other underlying weaknesses in the numbers.
Check out our latest analysis for Shenzhen CECport Technologies
Zooming In On Shenzhen CECport Technologies' Earnings
Many investors haven't heard of the accrual ratio from cashflow, but it is actually a useful measure of how well a company's profit is backed up by free cash flow (FCF) during a given period. The accrual ratio subtracts the FCF from the profit for a given period, and divides the result by the average operating assets of the company over that time. This ratio tells us how much of a company's profit is not backed by free cashflow.
Therefore, it's actually considered a good thing when a company has a negative accrual ratio, but a bad thing if its accrual ratio is positive. While it's not a problem to have a positive accrual ratio, indicating a certain level of non-cash profits, a high accrual ratio is arguably a bad thing, because it indicates paper profits are not matched by cash flow. To quote a 2014 paper by Lewellen and Resutek, "firms with higher accruals tend to be less profitable in the future".
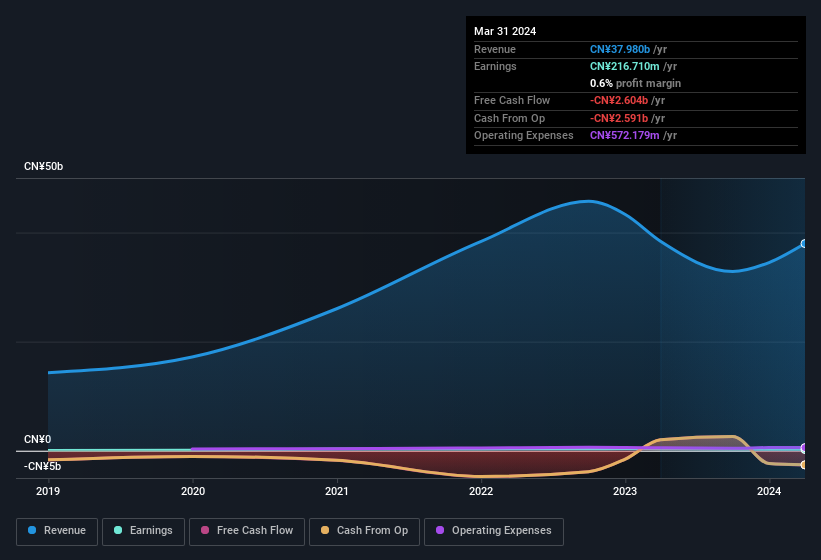
For the year to March 2024, Shenzhen CECport Technologies had an accrual ratio of 0.21. Therefore, we know that it's free cashflow was significantly lower than its statutory profit, which is hardly a good thing. Even though it reported a profit of CN¥216.7m, a look at free cash flow indicates it actually burnt through CN¥2.6b in the last year. It's worth noting that Shenzhen CECport Technologies generated positive FCF of CN¥2.0b a year ago, so at least they've done it in the past. One positive for Shenzhen CECport Technologies shareholders is that it's accrual ratio was significantly better last year, providing reason to believe that it may return to stronger cash conversion in the future. Shareholders should look for improved cashflow relative to profit in the current year, if that is indeed the case.
Note: we always recommend investors check balance sheet strength. Click here to be taken to our balance sheet analysis of Shenzhen CECport Technologies.
Our Take On Shenzhen CECport Technologies' Profit Performance
Shenzhen CECport Technologies didn't convert much of its profit to free cash flow in the last year, which some investors may consider rather suboptimal. Because of this, we think that it may be that Shenzhen CECport Technologies' statutory profits are better than its underlying earnings power. In further bad news, its earnings per share decreased in the last year. The goal of this article has been to assess how well we can rely on the statutory earnings to reflect the company's potential, but there is plenty more to consider. If you want to do dive deeper into Shenzhen CECport Technologies, you'd also look into what risks it is currently facing. Our analysis shows 3 warning signs for Shenzhen CECport Technologies (2 are potentially serious!) and we strongly recommend you look at them before investing.
This note has only looked at a single factor that sheds light on the nature of Shenzhen CECport Technologies' profit. But there is always more to discover if you are capable of focussing your mind on minutiae. For example, many people consider a high return on equity as an indication of favorable business economics, while others like to 'follow the money' and search out stocks that insiders are buying. So you may wish to see this free collection of companies boasting high return on equity, or this list of stocks that insiders are buying.
New: Manage All Your Stock Portfolios in One Place
We've created the ultimate portfolio companion for stock investors, and it's free.
• Connect an unlimited number of Portfolios and see your total in one currency
• Be alerted to new Warning Signs or Risks via email or mobile
• Track the Fair Value of your stocks
Have feedback on this article? Concerned about the content? Get in touch with us directly. Alternatively, email editorial-team (at) simplywallst.com.
This article by Simply Wall St is general in nature. We provide commentary based on historical data and analyst forecasts only using an unbiased methodology and our articles are not intended to be financial advice. It does not constitute a recommendation to buy or sell any stock, and does not take account of your objectives, or your financial situation. We aim to bring you long-term focused analysis driven by fundamental data. Note that our analysis may not factor in the latest price-sensitive company announcements or qualitative material. Simply Wall St has no position in any stocks mentioned.
About SZSE:001287
Shenzhen CECport Technologies
Engages in electronic component distribution business in China.
Moderate risk and slightly overvalued.
Market Insights

Advertisement
Community Narratives
MicroVision will explode future revenue by 380.37% with a vision towards success
Fair Value US$60.00|98.4% undervalued
TH
Community Contributor
The Indispensable Artery for a New North American Economy
Fair Value CA$132.87|1.3% undervalued
TI
Community Contributor