
Advertisement
- China
- /
- Communications
- /
- SZSE:000070
Shenzhen SDG Information Co., Ltd. (SZSE:000070) Looks Inexpensive After Falling 26% But Perhaps Not Attractive Enough
Shenzhen SDG Information Co., Ltd. (SZSE:000070) shareholders won't be pleased to see that the share price has had a very rough month, dropping 26% and undoing the prior period's positive performance. Instead of being rewarded, shareholders who have already held through the last twelve months are now sitting on a 25% share price drop.
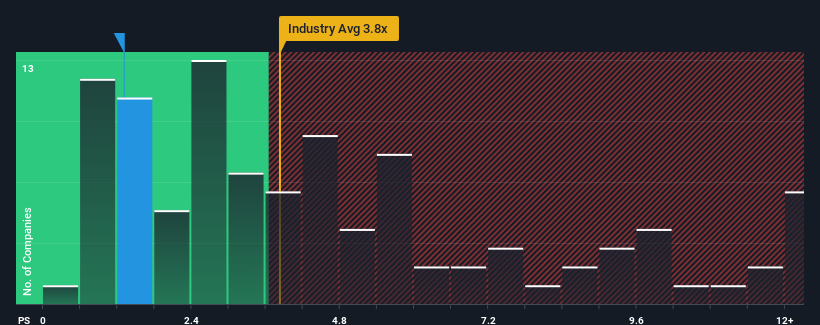
Following the heavy fall in price, Shenzhen SDG Information may be sending very bullish signals at the moment with its price-to-sales (or "P/S") ratio of 1.3x, since almost half of all companies in the Communications industry in China have P/S ratios greater than 3.8x and even P/S higher than 7x are not unusual. Nonetheless, we'd need to dig a little deeper to determine if there is a rational basis for the highly reduced P/S.
View our latest analysis for Shenzhen SDG Information
How Shenzhen SDG Information Has Been Performing
Revenue has risen at a steady rate over the last year for Shenzhen SDG Information, which is generally not a bad outcome. Perhaps the market believes the recent revenue performance might fall short of industry figures in the near future, leading to a reduced P/S. If that doesn't eventuate, then existing shareholders may have reason to be optimistic about the future direction of the share price.
Although there are no analyst estimates available for Shenzhen SDG Information, take a look at this free data-rich visualisation to see how the company stacks up on earnings, revenue and cash flow.How Is Shenzhen SDG Information's Revenue Growth Trending?
Shenzhen SDG Information's P/S ratio would be typical for a company that's expected to deliver very poor growth or even falling revenue, and importantly, perform much worse than the industry.
Taking a look back first, we see that the company managed to grow revenues by a handy 6.5% last year. The latest three year period has also seen a 16% overall rise in revenue, aided somewhat by its short-term performance. Accordingly, shareholders would have probably been satisfied with the medium-term rates of revenue growth.
This is in contrast to the rest of the industry, which is expected to grow by 50% over the next year, materially higher than the company's recent medium-term annualised growth rates.
With this in consideration, it's easy to understand why Shenzhen SDG Information's P/S falls short of the mark set by its industry peers. It seems most investors are expecting to see the recent limited growth rates continue into the future and are only willing to pay a reduced amount for the stock.
What We Can Learn From Shenzhen SDG Information's P/S?
Shares in Shenzhen SDG Information have plummeted and its P/S has followed suit. Typically, we'd caution against reading too much into price-to-sales ratios when settling on investment decisions, though it can reveal plenty about what other market participants think about the company.
As we suspected, our examination of Shenzhen SDG Information revealed its three-year revenue trends are contributing to its low P/S, given they look worse than current industry expectations. At this stage investors feel the potential for an improvement in revenue isn't great enough to justify a higher P/S ratio. Unless the recent medium-term conditions improve, they will continue to form a barrier for the share price around these levels.
Having said that, be aware Shenzhen SDG Information is showing 4 warning signs in our investment analysis, and 3 of those don't sit too well with us.
If these risks are making you reconsider your opinion on Shenzhen SDG Information, explore our interactive list of high quality stocks to get an idea of what else is out there.
New: Manage All Your Stock Portfolios in One Place
We've created the ultimate portfolio companion for stock investors, and it's free.
• Connect an unlimited number of Portfolios and see your total in one currency
• Be alerted to new Warning Signs or Risks via email or mobile
• Track the Fair Value of your stocks
Have feedback on this article? Concerned about the content? Get in touch with us directly. Alternatively, email editorial-team (at) simplywallst.com.
This article by Simply Wall St is general in nature. We provide commentary based on historical data and analyst forecasts only using an unbiased methodology and our articles are not intended to be financial advice. It does not constitute a recommendation to buy or sell any stock, and does not take account of your objectives, or your financial situation. We aim to bring you long-term focused analysis driven by fundamental data. Note that our analysis may not factor in the latest price-sensitive company announcements or qualitative material. Simply Wall St has no position in any stocks mentioned.
About SZSE:000070
Shenzhen SDG Information
Manufactures and sells fiber- optic cable, wiring network equipment, and communication equipment in the People’s Republic of China and internationally.
Adequate balance sheet and slightly overvalued.
Market Insights

Advertisement
Community Narratives
MicroVision will explode future revenue by 380.37% with a vision towards success
Fair Value US$60|98.4% undervalued
TH
Community Contributor
The Indispensable Artery for a New North American Economy
Fair Value CA$132.87|0.6% undervalued
TI
Community Contributor
Recently Updated Narratives
MA


MarkoVT on COVER ·
Q3 Outlook modestly optimistic
Fair Value:JP¥1.65k2.0% overvalued
1 followerusers have followed this narrative
0 commentsusers have commented on this narrative
0 likesusers have liked this narrative
BL


BlackGoat on Alphabet ·
Alphabet: The Under-appreciated Compounder Hiding in Plain Sight
Fair Value:US$324.481.3% undervalued
76 followersusers have followed this narrative
3 commentsusers have commented on this narrative
1 likeusers have liked this narrative
BE


Bejgal on MINISO Group Holding ·
MINISO's fair value is projected at 26.69 with an anticipated PE ratio shift of 20x
Fair Value:US$26.6926.7% undervalued
46 followersusers have followed this narrative
3 commentsusers have commented on this narrative
0 likesusers have liked this narrative
Popular Narratives
OS

oscargarcia on Alphabet ·
The company that turned a verb into a global necessity and basically runs the modern internet, digital ads, smartphones, maps, and AI.
Fair Value:US$3405.9% undervalued
136 followersusers have followed this narrative
6 commentsusers have commented on this narrative
18 likesusers have liked this narrative
TH

TheWallstreetKing on MicroVision ·
MicroVision will explode future revenue by 380.37% with a vision towards success
Fair Value:US$6098.4% undervalued
90 followersusers have followed this narrative
10 commentsusers have commented on this narrative
18 likesusers have liked this narrative
AN


AnalystConsensusTarget on NVIDIA ·
NVDA: Expanding AI Demand Will Drive Major Data Center Investments Through 2026
Fair Value:US$232.7922.6% undervalued
928 followersusers have followed this narrative
6 commentsusers have commented on this narrative
22 likesusers have liked this narrative