Stock Analysis
- China
- /
- Electronic Equipment and Components
- /
- SZSE:000062
Investors three-year losses continue as Shenzhen Huaqiang Industry (SZSE:000062) dips a further 6.4% this week, earnings continue to decline


In order to justify the effort of selecting individual stocks, it's worth striving to beat the returns from a market index fund. But if you try your hand at stock picking, you risk returning less than the market. Unfortunately, that's been the case for longer term Shenzhen Huaqiang Industry Co., Ltd. (SZSE:000062) shareholders, since the share price is down 38% in the last three years, falling well short of the market decline of around 20%. On top of that, the share price is down 6.4% in the last week.
After losing 6.4% this past week, it's worth investigating the company's fundamentals to see what we can infer from past performance.
Check out our latest analysis for Shenzhen Huaqiang Industry
While the efficient markets hypothesis continues to be taught by some, it has been proven that markets are over-reactive dynamic systems, and investors are not always rational. One way to examine how market sentiment has changed over time is to look at the interaction between a company's share price and its earnings per share (EPS).
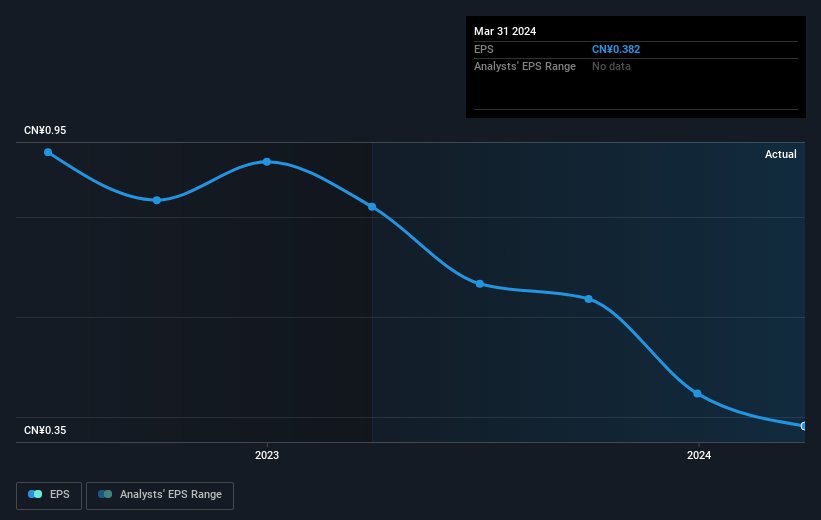
During the three years that the share price fell, Shenzhen Huaqiang Industry's earnings per share (EPS) dropped by 19% each year. In comparison the 15% compound annual share price decline isn't as bad as the EPS drop-off. So, despite the prior disappointment, shareholders must have some confidence the situation will improve, longer term.
You can see below how EPS has changed over time (discover the exact values by clicking on the image).
It might be well worthwhile taking a look at our free report on Shenzhen Huaqiang Industry's earnings, revenue and cash flow.
What About Dividends?
As well as measuring the share price return, investors should also consider the total shareholder return (TSR). The TSR is a return calculation that accounts for the value of cash dividends (assuming that any dividend received was reinvested) and the calculated value of any discounted capital raisings and spin-offs. So for companies that pay a generous dividend, the TSR is often a lot higher than the share price return. We note that for Shenzhen Huaqiang Industry the TSR over the last 3 years was -35%, which is better than the share price return mentioned above. And there's no prize for guessing that the dividend payments largely explain the divergence!
A Different Perspective
We regret to report that Shenzhen Huaqiang Industry shareholders are down 18% for the year (even including dividends). Unfortunately, that's worse than the broader market decline of 8.9%. However, it could simply be that the share price has been impacted by broader market jitters. It might be worth keeping an eye on the fundamentals, in case there's a good opportunity. Regrettably, last year's performance caps off a bad run, with the shareholders facing a total loss of 5% per year over five years. We realise that Baron Rothschild has said investors should "buy when there is blood on the streets", but we caution that investors should first be sure they are buying a high quality business. It's always interesting to track share price performance over the longer term. But to understand Shenzhen Huaqiang Industry better, we need to consider many other factors. Take risks, for example - Shenzhen Huaqiang Industry has 3 warning signs (and 1 which can't be ignored) we think you should know about.
Of course Shenzhen Huaqiang Industry may not be the best stock to buy. So you may wish to see this free collection of growth stocks.
Please note, the market returns quoted in this article reflect the market weighted average returns of stocks that currently trade on Chinese exchanges.
Valuation is complex, but we're helping make it simple.
Find out whether Shenzhen Huaqiang Industry is potentially over or undervalued by checking out our comprehensive analysis, which includes fair value estimates, risks and warnings, dividends, insider transactions and financial health.
View the Free AnalysisHave feedback on this article? Concerned about the content? Get in touch with us directly. Alternatively, email editorial-team (at) simplywallst.com.
This article by Simply Wall St is general in nature. We provide commentary based on historical data and analyst forecasts only using an unbiased methodology and our articles are not intended to be financial advice. It does not constitute a recommendation to buy or sell any stock, and does not take account of your objectives, or your financial situation. We aim to bring you long-term focused analysis driven by fundamental data. Note that our analysis may not factor in the latest price-sensitive company announcements or qualitative material. Simply Wall St has no position in any stocks mentioned.
About SZSE:000062
Shenzhen Huaqiang Industry
Operates as an electronic components distributor in China.
Average dividend payer with mediocre balance sheet.
