
Advertisement
- China
- /
- Electronic Equipment and Components
- /
- SHSE:688071
The Price Is Right For Shanghai W-Ibeda High Tech.Group Co.,Ltd. (SHSE:688071) Even After Diving 27%
Shanghai W-Ibeda High Tech.Group Co.,Ltd. (SHSE:688071) shareholders that were waiting for something to happen have been dealt a blow with a 27% share price drop in the last month. For any long-term shareholders, the last month ends a year to forget by locking in a 53% share price decline.
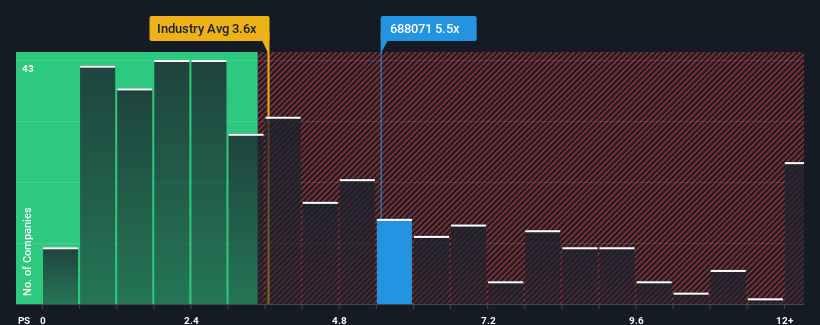
Although its price has dipped substantially, given close to half the companies operating in China's Electronic industry have price-to-sales ratios (or "P/S") below 3.6x, you may still consider Shanghai W-Ibeda High Tech.GroupLtd as a stock to potentially avoid with its 5.5x P/S ratio. Although, it's not wise to just take the P/S at face value as there may be an explanation why it's as high as it is.
Check out our latest analysis for Shanghai W-Ibeda High Tech.GroupLtd
What Does Shanghai W-Ibeda High Tech.GroupLtd's P/S Mean For Shareholders?
While the industry has experienced revenue growth lately, Shanghai W-Ibeda High Tech.GroupLtd's revenue has gone into reverse gear, which is not great. Perhaps the market is expecting the poor revenue to reverse, justifying it's current high P/S.. However, if this isn't the case, investors might get caught out paying too much for the stock.
Want the full picture on analyst estimates for the company? Then our free report on Shanghai W-Ibeda High Tech.GroupLtd will help you uncover what's on the horizon.What Are Revenue Growth Metrics Telling Us About The High P/S?
In order to justify its P/S ratio, Shanghai W-Ibeda High Tech.GroupLtd would need to produce impressive growth in excess of the industry.
In reviewing the last year of financials, we were disheartened to see the company's revenues fell to the tune of 10%. This has soured the latest three-year period, which nevertheless managed to deliver a decent 12% overall rise in revenue. So we can start by confirming that the company has generally done a good job of growing revenue over that time, even though it had some hiccups along the way.
Shifting to the future, estimates from the dual analysts covering the company suggest revenue should grow by 165% over the next year. Meanwhile, the rest of the industry is forecast to only expand by 26%, which is noticeably less attractive.
With this information, we can see why Shanghai W-Ibeda High Tech.GroupLtd is trading at such a high P/S compared to the industry. Apparently shareholders aren't keen to offload something that is potentially eyeing a more prosperous future.
The Bottom Line On Shanghai W-Ibeda High Tech.GroupLtd's P/S
Despite the recent share price weakness, Shanghai W-Ibeda High Tech.GroupLtd's P/S remains higher than most other companies in the industry. It's argued the price-to-sales ratio is an inferior measure of value within certain industries, but it can be a powerful business sentiment indicator.
We've established that Shanghai W-Ibeda High Tech.GroupLtd maintains its high P/S on the strength of its forecasted revenue growth being higher than the the rest of the Electronic industry, as expected. At this stage investors feel the potential for a deterioration in revenues is quite remote, justifying the elevated P/S ratio. It's hard to see the share price falling strongly in the near future under these circumstances.
Having said that, be aware Shanghai W-Ibeda High Tech.GroupLtd is showing 2 warning signs in our investment analysis, and 1 of those is concerning.
It's important to make sure you look for a great company, not just the first idea you come across. So if growing profitability aligns with your idea of a great company, take a peek at this free list of interesting companies with strong recent earnings growth (and a low P/E).
New: Manage All Your Stock Portfolios in One Place
We've created the ultimate portfolio companion for stock investors, and it's free.
• Connect an unlimited number of Portfolios and see your total in one currency
• Be alerted to new Warning Signs or Risks via email or mobile
• Track the Fair Value of your stocks
Have feedback on this article? Concerned about the content? Get in touch with us directly. Alternatively, email editorial-team (at) simplywallst.com.
This article by Simply Wall St is general in nature. We provide commentary based on historical data and analyst forecasts only using an unbiased methodology and our articles are not intended to be financial advice. It does not constitute a recommendation to buy or sell any stock, and does not take account of your objectives, or your financial situation. We aim to bring you long-term focused analysis driven by fundamental data. Note that our analysis may not factor in the latest price-sensitive company announcements or qualitative material. Simply Wall St has no position in any stocks mentioned.
About SHSE:688071
Shanghai W-Ibeda High Tech.GroupLtd
Shanghai W-Ibeda High Tech.Group Co.,Ltd.
High growth potential with very low risk.
Market Insights

Advertisement
Community Narratives
MINISO's fair value is projected at 26.69 with an anticipated PE ratio shift of 20x
Fair Value US$24.03|12.0% undervalued
BE
Community Contributor
Procter & Gamble: A Dividend Giant Facing Slowing Growth
Fair Value US$119.81|21.7% overvalued
AN
Community Contributor
Eli Lilly's Future Growth Driven by Tirzepatide and Favorable Market Conditions
Fair Value US$1.19k|14.1% undervalued
EA
Community Contributor