
Advertisement
- China
- /
- Electronic Equipment and Components
- /
- SHSE:688071
Shanghai W-Ibeda High Tech.Group Co.,Ltd.'s (SHSE:688071) 33% Cheaper Price Remains In Tune With Revenues
To the annoyance of some shareholders, Shanghai W-Ibeda High Tech.Group Co.,Ltd. (SHSE:688071) shares are down a considerable 33% in the last month, which continues a horrid run for the company. For any long-term shareholders, the last month ends a year to forget by locking in a 57% share price decline.
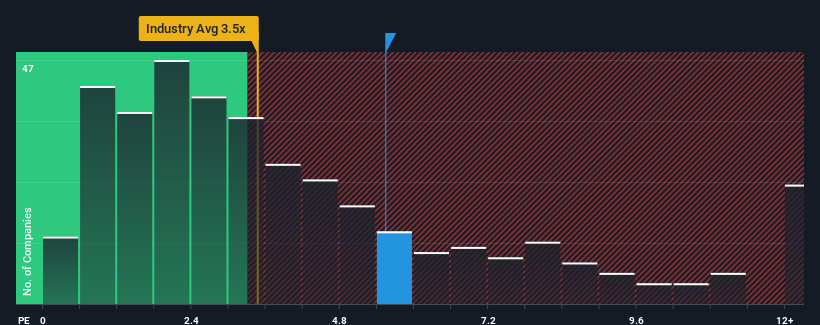
Although its price has dipped substantially, you could still be forgiven for thinking Shanghai W-Ibeda High Tech.GroupLtd is a stock to steer clear of with a price-to-sales ratios (or "P/S") of 5.5x, considering almost half the companies in China's Electronic industry have P/S ratios below 3.5x. Nonetheless, we'd need to dig a little deeper to determine if there is a rational basis for the highly elevated P/S.
View our latest analysis for Shanghai W-Ibeda High Tech.GroupLtd
How Has Shanghai W-Ibeda High Tech.GroupLtd Performed Recently?
While the industry has experienced revenue growth lately, Shanghai W-Ibeda High Tech.GroupLtd's revenue has gone into reverse gear, which is not great. It might be that many expect the dour revenue performance to recover substantially, which has kept the P/S from collapsing. If not, then existing shareholders may be extremely nervous about the viability of the share price.
Keen to find out how analysts think Shanghai W-Ibeda High Tech.GroupLtd's future stacks up against the industry? In that case, our free report is a great place to start.Do Revenue Forecasts Match The High P/S Ratio?
There's an inherent assumption that a company should far outperform the industry for P/S ratios like Shanghai W-Ibeda High Tech.GroupLtd's to be considered reasonable.
Taking a look back first, the company's revenue growth last year wasn't something to get excited about as it posted a disappointing decline of 5.2%. This has soured the latest three-year period, which nevertheless managed to deliver a decent 15% overall rise in revenue. Although it's been a bumpy ride, it's still fair to say the revenue growth recently has been mostly respectable for the company.
Shifting to the future, estimates from the one analyst covering the company suggest revenue should grow by 144% over the next year. With the industry only predicted to deliver 23%, the company is positioned for a stronger revenue result.
In light of this, it's understandable that Shanghai W-Ibeda High Tech.GroupLtd's P/S sits above the majority of other companies. It seems most investors are expecting this strong future growth and are willing to pay more for the stock.
What Does Shanghai W-Ibeda High Tech.GroupLtd's P/S Mean For Investors?
A significant share price dive has done very little to deflate Shanghai W-Ibeda High Tech.GroupLtd's very lofty P/S. It's argued the price-to-sales ratio is an inferior measure of value within certain industries, but it can be a powerful business sentiment indicator.
We've established that Shanghai W-Ibeda High Tech.GroupLtd maintains its high P/S on the strength of its forecasted revenue growth being higher than the the rest of the Electronic industry, as expected. It appears that shareholders are confident in the company's future revenues, which is propping up the P/S. Unless the analysts have really missed the mark, these strong revenue forecasts should keep the share price buoyant.
Before you settle on your opinion, we've discovered 4 warning signs for Shanghai W-Ibeda High Tech.GroupLtd (2 are concerning!) that you should be aware of.
If companies with solid past earnings growth is up your alley, you may wish to see this free collection of other companies with strong earnings growth and low P/E ratios.
New: Manage All Your Stock Portfolios in One Place
We've created the ultimate portfolio companion for stock investors, and it's free.
• Connect an unlimited number of Portfolios and see your total in one currency
• Be alerted to new Warning Signs or Risks via email or mobile
• Track the Fair Value of your stocks
Have feedback on this article? Concerned about the content? Get in touch with us directly. Alternatively, email editorial-team (at) simplywallst.com.
This article by Simply Wall St is general in nature. We provide commentary based on historical data and analyst forecasts only using an unbiased methodology and our articles are not intended to be financial advice. It does not constitute a recommendation to buy or sell any stock, and does not take account of your objectives, or your financial situation. We aim to bring you long-term focused analysis driven by fundamental data. Note that our analysis may not factor in the latest price-sensitive company announcements or qualitative material. Simply Wall St has no position in any stocks mentioned.
About SHSE:688071
Shanghai W-Ibeda High Tech.GroupLtd
Shanghai W-Ibeda High Tech.Group Co.,Ltd.
High growth potential with very low risk.
Market Insights

Advertisement
Community Narratives
MINISO's fair value is projected at 26.69 with an anticipated PE ratio shift of 20x
Fair Value US$24.03|12.0% undervalued
BE
Community Contributor
Procter & Gamble: A Dividend Giant Facing Slowing Growth
Fair Value US$119.81|21.7% overvalued
AN
Community Contributor
Eli Lilly's Future Growth Driven by Tirzepatide and Favorable Market Conditions
Fair Value US$1.19k|14.1% undervalued
EA
Community Contributor