
Advertisement
- China
- /
- Electronic Equipment and Components
- /
- SHSE:603186
Market Might Still Lack Some Conviction On Zhejiang Wazam New Materials Co.,LTD. (SHSE:603186) Even After 29% Share Price Boost
Zhejiang Wazam New Materials Co.,LTD. (SHSE:603186) shareholders are no doubt pleased to see that the share price has bounced 29% in the last month, although it is still struggling to make up recently lost ground. Unfortunately, the gains of the last month did little to right the losses of the last year with the stock still down 29% over that time.
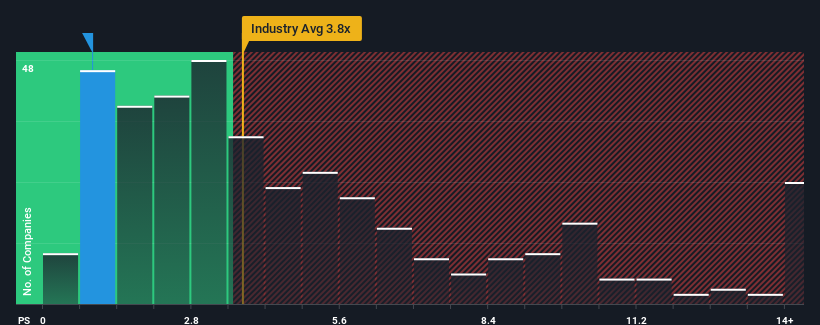
Even after such a large jump in price, Zhejiang Wazam New MaterialsLTD may still be sending very bullish signals at the moment with its price-to-sales (or "P/S") ratio of 0.9x, since almost half of all companies in the Electronic industry in China have P/S ratios greater than 3.8x and even P/S higher than 7x are not unusual. However, the P/S might be quite low for a reason and it requires further investigation to determine if it's justified.
Check out our latest analysis for Zhejiang Wazam New MaterialsLTD
What Does Zhejiang Wazam New MaterialsLTD's Recent Performance Look Like?
Zhejiang Wazam New MaterialsLTD's revenue growth of late has been pretty similar to most other companies. It might be that many expect the mediocre revenue performance to degrade, which has repressed the P/S ratio. If you like the company, you'd be hoping this isn't the case so that you could pick up some stock while it's out of favour.
Keen to find out how analysts think Zhejiang Wazam New MaterialsLTD's future stacks up against the industry? In that case, our free report is a great place to start.Do Revenue Forecasts Match The Low P/S Ratio?
The only time you'd be truly comfortable seeing a P/S as depressed as Zhejiang Wazam New MaterialsLTD's is when the company's growth is on track to lag the industry decidedly.
Taking a look back first, we see that the company managed to grow revenues by a handy 2.6% last year. Pleasingly, revenue has also lifted 62% in aggregate from three years ago, partly thanks to the last 12 months of growth. So we can start by confirming that the company has done a great job of growing revenues over that time.
Looking ahead now, revenue is anticipated to climb by 43% during the coming year according to the dual analysts following the company. With the industry only predicted to deliver 25%, the company is positioned for a stronger revenue result.
With this information, we find it odd that Zhejiang Wazam New MaterialsLTD is trading at a P/S lower than the industry. It looks like most investors are not convinced at all that the company can achieve future growth expectations.
The Key Takeaway
Even after such a strong price move, Zhejiang Wazam New MaterialsLTD's P/S still trails the rest of the industry. We'd say the price-to-sales ratio's power isn't primarily as a valuation instrument but rather to gauge current investor sentiment and future expectations.
Zhejiang Wazam New MaterialsLTD's analyst forecasts revealed that its superior revenue outlook isn't contributing to its P/S anywhere near as much as we would have predicted. There could be some major risk factors that are placing downward pressure on the P/S ratio. At least price risks look to be very low, but investors seem to think future revenues could see a lot of volatility.
It's always necessary to consider the ever-present spectre of investment risk. We've identified 2 warning signs with Zhejiang Wazam New MaterialsLTD (at least 1 which is potentially serious), and understanding these should be part of your investment process.
Of course, profitable companies with a history of great earnings growth are generally safer bets. So you may wish to see this free collection of other companies that have reasonable P/E ratios and have grown earnings strongly.
Valuation is complex, but we're here to simplify it.
Discover if Zhejiang Wazam New MaterialsLTD might be undervalued or overvalued with our detailed analysis, featuring fair value estimates, potential risks, dividends, insider trades, and its financial condition.
Access Free AnalysisHave feedback on this article? Concerned about the content? Get in touch with us directly. Alternatively, email editorial-team (at) simplywallst.com.
This article by Simply Wall St is general in nature. We provide commentary based on historical data and analyst forecasts only using an unbiased methodology and our articles are not intended to be financial advice. It does not constitute a recommendation to buy or sell any stock, and does not take account of your objectives, or your financial situation. We aim to bring you long-term focused analysis driven by fundamental data. Note that our analysis may not factor in the latest price-sensitive company announcements or qualitative material. Simply Wall St has no position in any stocks mentioned.
About SHSE:603186
Zhejiang Wazam New MaterialsLTD
Engages in the research, development, design, production, and sale of copper clad plate , composite materials, and membrane materials.
Low risk and slightly overvalued.
Market Insights

Advertisement
Community Narratives
MINISO's fair value is projected at 26.69 with an anticipated PE ratio shift of 20x
Fair Value US$24.03|11.0% undervalued
BE
Community Contributor
Procter & Gamble: A Dividend Giant Facing Slowing Growth
Fair Value US$119.81|23.3% overvalued
AN
Community Contributor
Eli Lilly's Future Growth Driven by Tirzepatide and Favorable Market Conditions
Fair Value US$1.19k|13.8% undervalued
EA
Community Contributor