
Advertisement
- China
- /
- Electronic Equipment and Components
- /
- SHSE:600330
TDG Holding Co., Ltd. (SHSE:600330) Stock's Been Sliding But Fundamentals Look Decent: Will The Market Correct The Share Price In The Future?

With its stock down 16% over the past three months, it is easy to disregard TDG Holding (SHSE:600330). However, stock prices are usually driven by a company’s financials over the long term, which in this case look pretty respectable. Particularly, we will be paying attention to TDG Holding's ROE today.
ROE or return on equity is a useful tool to assess how effectively a company can generate returns on the investment it received from its shareholders. Put another way, it reveals the company's success at turning shareholder investments into profits.
See our latest analysis for TDG Holding
How To Calculate Return On Equity?
ROE can be calculated by using the formula:
Return on Equity = Net Profit (from continuing operations) ÷ Shareholders' Equity
So, based on the above formula, the ROE for TDG Holding is:
3.4% = CN¥280m ÷ CN¥8.1b (Based on the trailing twelve months to March 2024).
The 'return' is the profit over the last twelve months. Another way to think of that is that for every CN¥1 worth of equity, the company was able to earn CN¥0.03 in profit.
Why Is ROE Important For Earnings Growth?
Thus far, we have learned that ROE measures how efficiently a company is generating its profits. Depending on how much of these profits the company reinvests or "retains", and how effectively it does so, we are then able to assess a company’s earnings growth potential. Assuming everything else remains unchanged, the higher the ROE and profit retention, the higher the growth rate of a company compared to companies that don't necessarily bear these characteristics.
A Side By Side comparison of TDG Holding's Earnings Growth And 3.4% ROE
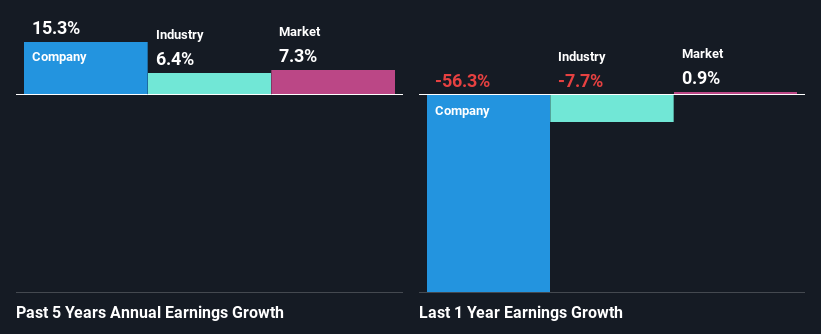
It is hard to argue that TDG Holding's ROE is much good in and of itself. Even when compared to the industry average of 6.3%, the ROE figure is pretty disappointing. TDG Holding was still able to see a decent net income growth of 15% over the past five years. We believe that there might be other aspects that are positively influencing the company's earnings growth. Such as - high earnings retention or an efficient management in place.
Next, on comparing with the industry net income growth, we found that TDG Holding's growth is quite high when compared to the industry average growth of 6.4% in the same period, which is great to see.
Earnings growth is an important metric to consider when valuing a stock. It’s important for an investor to know whether the market has priced in the company's expected earnings growth (or decline). By doing so, they will have an idea if the stock is headed into clear blue waters or if swampy waters await. If you're wondering about TDG Holding's's valuation, check out this gauge of its price-to-earnings ratio, as compared to its industry.
Is TDG Holding Making Efficient Use Of Its Profits?
TDG Holding's three-year median payout ratio to shareholders is 12% (implying that it retains 88% of its income), which is on the lower side, so it seems like the management is reinvesting profits heavily to grow its business.
Moreover, TDG Holding is determined to keep sharing its profits with shareholders which we infer from its long history of six years of paying a dividend.
Conclusion
Overall, we feel that TDG Holding certainly does have some positive factors to consider. Even in spite of the low rate of return, the company has posted impressive earnings growth as a result of reinvesting heavily into its business. Having said that, looking at the current analyst estimates, we found that the company's earnings are expected to gain momentum. To know more about the company's future earnings growth forecasts take a look at this free report on analyst forecasts for the company to find out more.
Valuation is complex, but we're here to simplify it.
Discover if TDG Holding might be undervalued or overvalued with our detailed analysis, featuring fair value estimates, potential risks, dividends, insider trades, and its financial condition.
Access Free AnalysisHave feedback on this article? Concerned about the content? Get in touch with us directly. Alternatively, email editorial-team (at) simplywallst.com.
This article by Simply Wall St is general in nature. We provide commentary based on historical data and analyst forecasts only using an unbiased methodology and our articles are not intended to be financial advice. It does not constitute a recommendation to buy or sell any stock, and does not take account of your objectives, or your financial situation. We aim to bring you long-term focused analysis driven by fundamental data. Note that our analysis may not factor in the latest price-sensitive company announcements or qualitative material. Simply Wall St has no position in any stocks mentioned.
About SHSE:600330
TDG Holding
Engages in the research and development, manufacture, and sale of electronic materials, digital devices, and smart equipment in China and internationally.
Excellent balance sheet with moderate growth potential.
Market Insights


Advertisement
Community Narratives
MicroStrategy: Volatile Gamble or Golden Opportunity?
Fair Value US$663.00|31.2% undervalued
BL
Community Contributor
Emerging Markets and Debt Reduction Will Propel Bath & Body Works Forward
Fair Value US$40.73|24.4% undervalued
ZW
Community Contributor
An amazing opportunity to potentially get a 100 bagger
Fair Value US$10.00|13.5% overvalued
DA
Community Contributor