
Advertisement
Sichuan Discovery Dream Science & Technology Co.,Ltd (SZSE:301213) Investors Are Less Pessimistic Than Expected
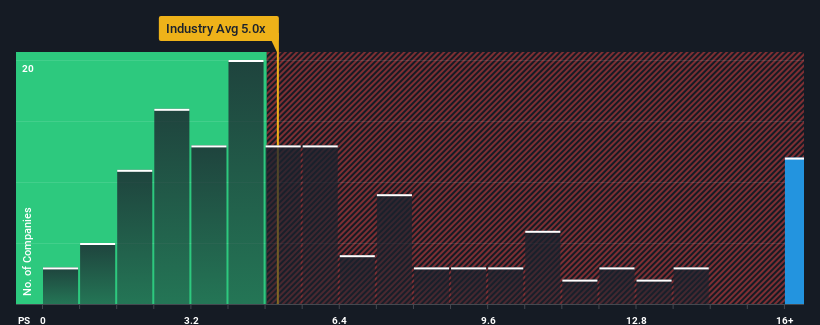
When you see that almost half of the companies in the Software industry in China have price-to-sales ratios (or "P/S") below 5x, Sichuan Discovery Dream Science & Technology Co.,Ltd (SZSE:301213) looks to be giving off strong sell signals with its 22.4x P/S ratio. Although, it's not wise to just take the P/S at face value as there may be an explanation why it's so lofty.
View our latest analysis for Sichuan Discovery Dream Science & TechnologyLtd
What Does Sichuan Discovery Dream Science & TechnologyLtd's P/S Mean For Shareholders?
As an illustration, revenue has deteriorated at Sichuan Discovery Dream Science & TechnologyLtd over the last year, which is not ideal at all. One possibility is that the P/S is high because investors think the company will still do enough to outperform the broader industry in the near future. If not, then existing shareholders may be quite nervous about the viability of the share price.
Want the full picture on earnings, revenue and cash flow for the company? Then our free report on Sichuan Discovery Dream Science & TechnologyLtd will help you shine a light on its historical performance.What Are Revenue Growth Metrics Telling Us About The High P/S?
In order to justify its P/S ratio, Sichuan Discovery Dream Science & TechnologyLtd would need to produce outstanding growth that's well in excess of the industry.
In reviewing the last year of financials, we were disheartened to see the company's revenues fell to the tune of 26%. This means it has also seen a slide in revenue over the longer-term as revenue is down 7.8% in total over the last three years. Therefore, it's fair to say the revenue growth recently has been undesirable for the company.
Weighing that medium-term revenue trajectory against the broader industry's one-year forecast for expansion of 34% shows it's an unpleasant look.
In light of this, it's alarming that Sichuan Discovery Dream Science & TechnologyLtd's P/S sits above the majority of other companies. It seems most investors are ignoring the recent poor growth rate and are hoping for a turnaround in the company's business prospects. Only the boldest would assume these prices are sustainable as a continuation of recent revenue trends is likely to weigh heavily on the share price eventually.
What Does Sichuan Discovery Dream Science & TechnologyLtd's P/S Mean For Investors?
Generally, our preference is to limit the use of the price-to-sales ratio to establishing what the market thinks about the overall health of a company.
Our examination of Sichuan Discovery Dream Science & TechnologyLtd revealed its shrinking revenue over the medium-term isn't resulting in a P/S as low as we expected, given the industry is set to grow. Right now we aren't comfortable with the high P/S as this revenue performance is highly unlikely to support such positive sentiment for long. If recent medium-term revenue trends continue, it will place shareholders' investments at significant risk and potential investors in danger of paying an excessive premium.
Plus, you should also learn about these 4 warning signs we've spotted with Sichuan Discovery Dream Science & TechnologyLtd (including 3 which don't sit too well with us).
If these risks are making you reconsider your opinion on Sichuan Discovery Dream Science & TechnologyLtd, explore our interactive list of high quality stocks to get an idea of what else is out there.
New: Manage All Your Stock Portfolios in One Place
We've created the ultimate portfolio companion for stock investors, and it's free.
• Connect an unlimited number of Portfolios and see your total in one currency
• Be alerted to new Warning Signs or Risks via email or mobile
• Track the Fair Value of your stocks
Have feedback on this article? Concerned about the content? Get in touch with us directly. Alternatively, email editorial-team (at) simplywallst.com.
This article by Simply Wall St is general in nature. We provide commentary based on historical data and analyst forecasts only using an unbiased methodology and our articles are not intended to be financial advice. It does not constitute a recommendation to buy or sell any stock, and does not take account of your objectives, or your financial situation. We aim to bring you long-term focused analysis driven by fundamental data. Note that our analysis may not factor in the latest price-sensitive company announcements or qualitative material. Simply Wall St has no position in any stocks mentioned.
About SZSE:301213
Sichuan Discovery Dream Science & TechnologyLtd
Engages in the development, production, and service of software and information technology services.
Mediocre balance sheet with minimal risk.
Market Insights

Advertisement
Community Narratives
MINISO's fair value is projected at 26.69 with an anticipated PE ratio shift of 20x
Fair Value US$24.03|11.0% undervalued
BE
Community Contributor
Procter & Gamble: A Dividend Giant Facing Slowing Growth
Fair Value US$119.81|23.3% overvalued
AN
Community Contributor
Eli Lilly's Future Growth Driven by Tirzepatide and Favorable Market Conditions
Fair Value US$1.19k|13.8% undervalued
EA
Community Contributor