
Advertisement
Hebei Gongda Keya Energy Technology Co.,Ltd.'s (SZSE:301197) Shares Climb 27% But Its Business Is Yet to Catch Up
Hebei Gongda Keya Energy Technology Co.,Ltd. (SZSE:301197) shareholders are no doubt pleased to see that the share price has bounced 27% in the last month, although it is still struggling to make up recently lost ground. Not all shareholders will be feeling jubilant, since the share price is still down a very disappointing 46% in the last twelve months.
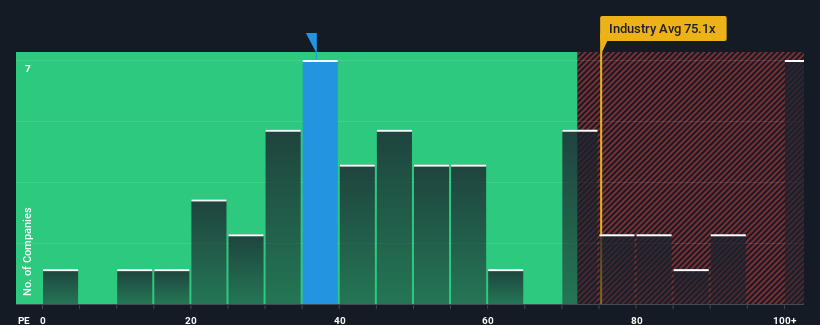
After such a large jump in price, Hebei Gongda Keya Energy TechnologyLtd's price-to-earnings (or "P/E") ratio of 36.8x might make it look like a sell right now compared to the market in China, where around half of the companies have P/E ratios below 29x and even P/E's below 18x are quite common. Although, it's not wise to just take the P/E at face value as there may be an explanation why it's as high as it is.
As an illustration, earnings have deteriorated at Hebei Gongda Keya Energy TechnologyLtd over the last year, which is not ideal at all. One possibility is that the P/E is high because investors think the company will still do enough to outperform the broader market in the near future. You'd really hope so, otherwise you're paying a pretty hefty price for no particular reason.
See our latest analysis for Hebei Gongda Keya Energy TechnologyLtd
What Are Growth Metrics Telling Us About The High P/E?
Hebei Gongda Keya Energy TechnologyLtd's P/E ratio would be typical for a company that's expected to deliver solid growth, and importantly, perform better than the market.
Retrospectively, the last year delivered a frustrating 62% decrease to the company's bottom line. As a result, earnings from three years ago have also fallen 55% overall. Accordingly, shareholders would have felt downbeat about the medium-term rates of earnings growth.
Weighing that medium-term earnings trajectory against the broader market's one-year forecast for expansion of 41% shows it's an unpleasant look.
With this information, we find it concerning that Hebei Gongda Keya Energy TechnologyLtd is trading at a P/E higher than the market. It seems most investors are ignoring the recent poor growth rate and are hoping for a turnaround in the company's business prospects. Only the boldest would assume these prices are sustainable as a continuation of recent earnings trends is likely to weigh heavily on the share price eventually.
The Bottom Line On Hebei Gongda Keya Energy TechnologyLtd's P/E
Hebei Gongda Keya Energy TechnologyLtd's P/E is getting right up there since its shares have risen strongly. Using the price-to-earnings ratio alone to determine if you should sell your stock isn't sensible, however it can be a practical guide to the company's future prospects.
Our examination of Hebei Gongda Keya Energy TechnologyLtd revealed its shrinking earnings over the medium-term aren't impacting its high P/E anywhere near as much as we would have predicted, given the market is set to grow. Right now we are increasingly uncomfortable with the high P/E as this earnings performance is highly unlikely to support such positive sentiment for long. Unless the recent medium-term conditions improve markedly, it's very challenging to accept these prices as being reasonable.
It is also worth noting that we have found 4 warning signs for Hebei Gongda Keya Energy TechnologyLtd (1 is significant!) that you need to take into consideration.
If P/E ratios interest you, you may wish to see this free collection of other companies with strong earnings growth and low P/E ratios.
Valuation is complex, but we're here to simplify it.
Discover if Hebei Gongda Keya Technology Group might be undervalued or overvalued with our detailed analysis, featuring fair value estimates, potential risks, dividends, insider trades, and its financial condition.
Access Free AnalysisHave feedback on this article? Concerned about the content? Get in touch with us directly. Alternatively, email editorial-team (at) simplywallst.com.
This article by Simply Wall St is general in nature. We provide commentary based on historical data and analyst forecasts only using an unbiased methodology and our articles are not intended to be financial advice. It does not constitute a recommendation to buy or sell any stock, and does not take account of your objectives, or your financial situation. We aim to bring you long-term focused analysis driven by fundamental data. Note that our analysis may not factor in the latest price-sensitive company announcements or qualitative material. Simply Wall St has no position in any stocks mentioned.
About SZSE:301197
Hebei Gongda Keya Technology Group
A software company, provides heating operation management and heating energy-saving technical services in China and internationally.
Adequate balance sheet with low risk.
Market Insights

Advertisement
Community Narratives
MicroVision will explode future revenue by 380.37% with a vision towards success
Fair Value US$60|98.4% undervalued
TH
Community Contributor
The Indispensable Artery for a New North American Economy
Fair Value CA$132.87|0.6% undervalued
TI
Community Contributor
Recently Updated Narratives
BL


BlackGoat on Alphabet ·
Alphabet: The Under-appreciated Compounder Hiding in Plain Sight
Fair Value:US$324.481.3% undervalued
76 followersusers have followed this narrative
3 commentsusers have commented on this narrative
1 likeusers have liked this narrative
BE


Bejgal on MINISO Group Holding ·
MINISO's fair value is projected at 26.69 with an anticipated PE ratio shift of 20x
Fair Value:US$26.6926.7% undervalued
45 followersusers have followed this narrative
3 commentsusers have commented on this narrative
0 likesusers have liked this narrative
TI


TickerTickle on Oracle ·
The Quiet Giant That Became AI’s Power Grid
Fair Value:US$389.8147.4% undervalued
9 followersusers have followed this narrative
1 commentusers have commented on this narrative
0 likesusers have liked this narrative
Popular Narratives
OS

oscargarcia on Alphabet ·
The company that turned a verb into a global necessity and basically runs the modern internet, digital ads, smartphones, maps, and AI.
Fair Value:US$3405.9% undervalued
136 followersusers have followed this narrative
6 commentsusers have commented on this narrative
18 likesusers have liked this narrative
TH

TheWallstreetKing on MicroVision ·
MicroVision will explode future revenue by 380.37% with a vision towards success
Fair Value:US$6098.4% undervalued
89 followersusers have followed this narrative
10 commentsusers have commented on this narrative
18 likesusers have liked this narrative
AN


AnalystConsensusTarget on NVIDIA ·
NVDA: Expanding AI Demand Will Drive Major Data Center Investments Through 2026
Fair Value:US$232.7922.6% undervalued
927 followersusers have followed this narrative
6 commentsusers have commented on this narrative
22 likesusers have liked this narrative