
Advertisement
The Price Is Right For Beijing YJK Building Software Co.,Ltd. (SZSE:300935) Even After Diving 25%
Unfortunately for some shareholders, the Beijing YJK Building Software Co.,Ltd. (SZSE:300935) share price has dived 25% in the last thirty days, prolonging recent pain. The recent drop completes a disastrous twelve months for shareholders, who are sitting on a 51% loss during that time.
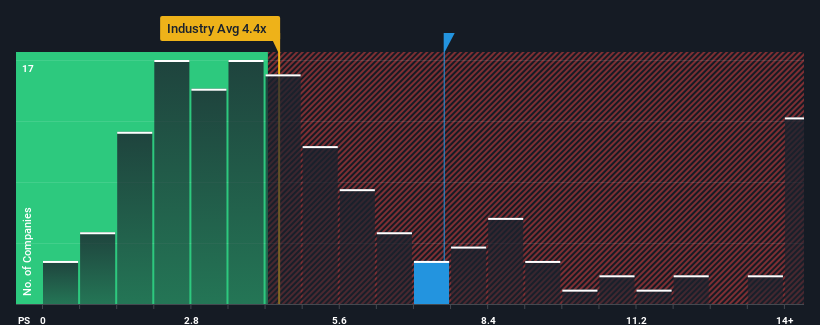
In spite of the heavy fall in price, Beijing YJK Building SoftwareLtd may still be sending strong sell signals at present with a price-to-sales (or "P/S") ratio of 7.6x, when you consider almost half of the companies in the Software industry in China have P/S ratios under 4.4x and even P/S lower than 2x aren't out of the ordinary. Nonetheless, we'd need to dig a little deeper to determine if there is a rational basis for the highly elevated P/S.
Check out our latest analysis for Beijing YJK Building SoftwareLtd
How Has Beijing YJK Building SoftwareLtd Performed Recently?
Beijing YJK Building SoftwareLtd hasn't been tracking well recently as its declining revenue compares poorly to other companies, which have seen some growth in their revenues on average. Perhaps the market is expecting the poor revenue to reverse, justifying it's current high P/S.. You'd really hope so, otherwise you're paying a pretty hefty price for no particular reason.
Keen to find out how analysts think Beijing YJK Building SoftwareLtd's future stacks up against the industry? In that case, our free report is a great place to start.How Is Beijing YJK Building SoftwareLtd's Revenue Growth Trending?
In order to justify its P/S ratio, Beijing YJK Building SoftwareLtd would need to produce outstanding growth that's well in excess of the industry.
Retrospectively, the last year delivered a frustrating 3.3% decrease to the company's top line. This has soured the latest three-year period, which nevertheless managed to deliver a decent 8.2% overall rise in revenue. So we can start by confirming that the company has generally done a good job of growing revenue over that time, even though it had some hiccups along the way.
Looking ahead now, revenue is anticipated to climb by 29% per year during the coming three years according to the one analyst following the company. Meanwhile, the rest of the industry is forecast to only expand by 24% per annum, which is noticeably less attractive.
In light of this, it's understandable that Beijing YJK Building SoftwareLtd's P/S sits above the majority of other companies. Apparently shareholders aren't keen to offload something that is potentially eyeing a more prosperous future.
What We Can Learn From Beijing YJK Building SoftwareLtd's P/S?
A significant share price dive has done very little to deflate Beijing YJK Building SoftwareLtd's very lofty P/S. It's argued the price-to-sales ratio is an inferior measure of value within certain industries, but it can be a powerful business sentiment indicator.
As we suspected, our examination of Beijing YJK Building SoftwareLtd's analyst forecasts revealed that its superior revenue outlook is contributing to its high P/S. It appears that shareholders are confident in the company's future revenues, which is propping up the P/S. Unless these conditions change, they will continue to provide strong support to the share price.
There are also other vital risk factors to consider before investing and we've discovered 1 warning sign for Beijing YJK Building SoftwareLtd that you should be aware of.
It's important to make sure you look for a great company, not just the first idea you come across. So if growing profitability aligns with your idea of a great company, take a peek at this free list of interesting companies with strong recent earnings growth (and a low P/E).
Valuation is complex, but we're here to simplify it.
Discover if Beijing YJK Building SoftwareLtd might be undervalued or overvalued with our detailed analysis, featuring fair value estimates, potential risks, dividends, insider trades, and its financial condition.
Access Free AnalysisHave feedback on this article? Concerned about the content? Get in touch with us directly. Alternatively, email editorial-team (at) simplywallst.com.
This article by Simply Wall St is general in nature. We provide commentary based on historical data and analyst forecasts only using an unbiased methodology and our articles are not intended to be financial advice. It does not constitute a recommendation to buy or sell any stock, and does not take account of your objectives, or your financial situation. We aim to bring you long-term focused analysis driven by fundamental data. Note that our analysis may not factor in the latest price-sensitive company announcements or qualitative material. Simply Wall St has no position in any stocks mentioned.
About SZSE:300935
Beijing YJK Building SoftwareLtd
Engages in the development, sale, and technical services of building structure design and BIM-related software products in China.
Mediocre balance sheet with very low risk.
Market Insights

Advertisement
Community Narratives
The company that turned a verb into a global necessity and basically runs the modern internet, digital ads, smartphones, maps, and AI.
Fair Value US$300.00|10.2% undervalued
OS
Community Contributor
Flowers Foods Pays A Fair Price For Health
Fair Value US$16.12|20.3% undervalued
NV
Community Contributor
TMX Group will thrive with 33.3% profit margin and enduring market moat
Fair Value CA$49.90|0.1% undervalued
LI
Community Contributor