ArcherMind Technology (Nanjing) Co., Ltd.'s (SZSE:300598) Shares Climb 26% But Its Business Is Yet to Catch Up
Despite an already strong run, ArcherMind Technology (Nanjing) Co., Ltd. (SZSE:300598) shares have been powering on, with a gain of 26% in the last thirty days. The last 30 days bring the annual gain to a very sharp 68%.
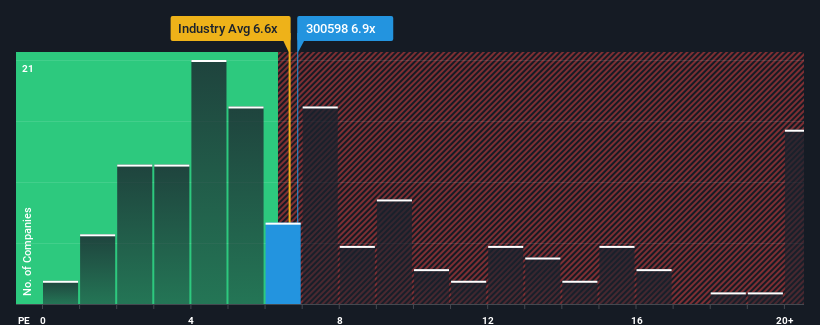
Even after such a large jump in price, it's still not a stretch to say that ArcherMind Technology (Nanjing)'s price-to-sales (or "P/S") ratio of 6.9x right now seems quite "middle-of-the-road" compared to the Software industry in China, where the median P/S ratio is around 6.6x. Although, it's not wise to simply ignore the P/S without explanation as investors may be disregarding a distinct opportunity or a costly mistake.
View our latest analysis for ArcherMind Technology (Nanjing)

What Does ArcherMind Technology (Nanjing)'s Recent Performance Look Like?
ArcherMind Technology (Nanjing) has been doing a decent job lately as it's been growing revenue at a reasonable pace. Perhaps the expectation moving forward is that the revenue growth will track in line with the wider industry for the near term, which has kept the P/S subdued. Those who are bullish on ArcherMind Technology (Nanjing) will be hoping that this isn't the case, so that they can pick up the stock at a lower valuation.
Although there are no analyst estimates available for ArcherMind Technology (Nanjing), take a look at this free data-rich visualisation to see how the company stacks up on earnings, revenue and cash flow.How Is ArcherMind Technology (Nanjing)'s Revenue Growth Trending?
ArcherMind Technology (Nanjing)'s P/S ratio would be typical for a company that's only expected to deliver moderate growth, and importantly, perform in line with the industry.
Retrospectively, the last year delivered a decent 6.2% gain to the company's revenues. Pleasingly, revenue has also lifted 49% in aggregate from three years ago, partly thanks to the last 12 months of growth. Accordingly, shareholders would have definitely welcomed those medium-term rates of revenue growth.
Comparing the recent medium-term revenue trends against the industry's one-year growth forecast of 33% shows it's noticeably less attractive.
With this in mind, we find it intriguing that ArcherMind Technology (Nanjing)'s P/S is comparable to that of its industry peers. Apparently many investors in the company are less bearish than recent times would indicate and aren't willing to let go of their stock right now. Maintaining these prices will be difficult to achieve as a continuation of recent revenue trends is likely to weigh down the shares eventually.
The Final Word
ArcherMind Technology (Nanjing) appears to be back in favour with a solid price jump bringing its P/S back in line with other companies in the industry While the price-to-sales ratio shouldn't be the defining factor in whether you buy a stock or not, it's quite a capable barometer of revenue expectations.
We've established that ArcherMind Technology (Nanjing)'s average P/S is a bit surprising since its recent three-year growth is lower than the wider industry forecast. Right now we are uncomfortable with the P/S as this revenue performance isn't likely to support a more positive sentiment for long. Unless there is a significant improvement in the company's medium-term performance, it will be difficult to prevent the P/S ratio from declining to a more reasonable level.
You always need to take note of risks, for example - ArcherMind Technology (Nanjing) has 3 warning signs we think you should be aware of.
It's important to make sure you look for a great company, not just the first idea you come across. So if growing profitability aligns with your idea of a great company, take a peek at this free list of interesting companies with strong recent earnings growth (and a low P/E).
New: Manage All Your Stock Portfolios in One Place
We've created the ultimate portfolio companion for stock investors, and it's free.
• Connect an unlimited number of Portfolios and see your total in one currency
• Be alerted to new Warning Signs or Risks via email or mobile
• Track the Fair Value of your stocks
Have feedback on this article? Concerned about the content? Get in touch with us directly. Alternatively, email editorial-team (at) simplywallst.com.
This article by Simply Wall St is general in nature. We provide commentary based on historical data and analyst forecasts only using an unbiased methodology and our articles are not intended to be financial advice. It does not constitute a recommendation to buy or sell any stock, and does not take account of your objectives, or your financial situation. We aim to bring you long-term focused analysis driven by fundamental data. Note that our analysis may not factor in the latest price-sensitive company announcements or qualitative material. Simply Wall St has no position in any stocks mentioned.
About SZSE:300598
ArcherMind Technology
Focuses on the research and development of sales of software technology services and solutions in China and internationally.
Mediocre balance sheet and slightly overvalued.
Market Insights
Community Narratives


Recently Updated Narratives


Engineered for Stability. Positioned for Growth.


MINISO's fair value is projected at 26.69 with an anticipated PE ratio shift of 20x


Fiverr International will transform the freelance industry with AI-powered growth
Popular Narratives


MicroVision will explode future revenue by 380.37% with a vision towards success


NVDA: Expanding AI Demand Will Drive Major Data Center Investments Through 2026


