
Advertisement
Anhui Wantong Technology Co.,Ltd. (SZSE:002331) Surges 28% Yet Its Low P/S Is No Reason For Excitement
Those holding Anhui Wantong Technology Co.,Ltd. (SZSE:002331) shares would be relieved that the share price has rebounded 28% in the last thirty days, but it needs to keep going to repair the recent damage it has caused to investor portfolios. Unfortunately, the gains of the last month did little to right the losses of the last year with the stock still down 15% over that time.
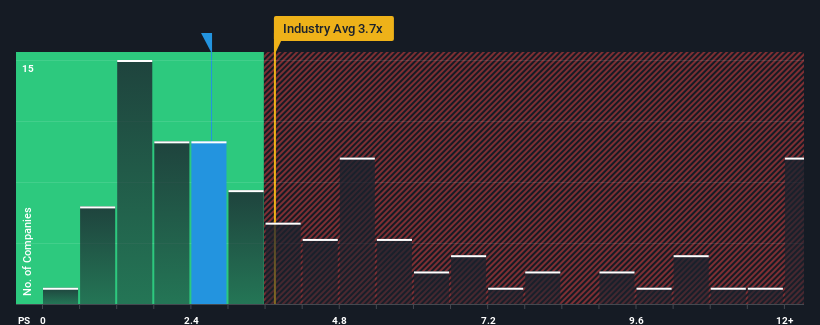
Even after such a large jump in price, Anhui Wantong TechnologyLtd may still be sending buy signals at present with its price-to-sales (or "P/S") ratio of 2.7x, considering almost half of all companies in the IT industry in China have P/S ratios greater than 3.7x and even P/S higher than 7x aren't out of the ordinary. Although, it's not wise to just take the P/S at face value as there may be an explanation why it's limited.
Check out our latest analysis for Anhui Wantong TechnologyLtd
What Does Anhui Wantong TechnologyLtd's P/S Mean For Shareholders?
Anhui Wantong TechnologyLtd has been doing a good job lately as it's been growing revenue at a solid pace. One possibility is that the P/S is low because investors think this respectable revenue growth might actually underperform the broader industry in the near future. Those who are bullish on Anhui Wantong TechnologyLtd will be hoping that this isn't the case, so that they can pick up the stock at a lower valuation.
Want the full picture on earnings, revenue and cash flow for the company? Then our free report on Anhui Wantong TechnologyLtd will help you shine a light on its historical performance.What Are Revenue Growth Metrics Telling Us About The Low P/S?
There's an inherent assumption that a company should underperform the industry for P/S ratios like Anhui Wantong TechnologyLtd's to be considered reasonable.
If we review the last year of revenue growth, the company posted a worthy increase of 12%. Still, lamentably revenue has fallen 32% in aggregate from three years ago, which is disappointing. So unfortunately, we have to acknowledge that the company has not done a great job of growing revenue over that time.
In contrast to the company, the rest of the industry is expected to grow by 41% over the next year, which really puts the company's recent medium-term revenue decline into perspective.
With this in mind, we understand why Anhui Wantong TechnologyLtd's P/S is lower than most of its industry peers. However, we think shrinking revenues are unlikely to lead to a stable P/S over the longer term, which could set up shareholders for future disappointment. Even just maintaining these prices could be difficult to achieve as recent revenue trends are already weighing down the shares.
The Key Takeaway
Anhui Wantong TechnologyLtd's stock price has surged recently, but its but its P/S still remains modest. Generally, our preference is to limit the use of the price-to-sales ratio to establishing what the market thinks about the overall health of a company.
It's no surprise that Anhui Wantong TechnologyLtd maintains its low P/S off the back of its sliding revenue over the medium-term. Right now shareholders are accepting the low P/S as they concede future revenue probably won't provide any pleasant surprises either. Given the current circumstances, it seems unlikely that the share price will experience any significant movement in either direction in the near future if recent medium-term revenue trends persist.
You always need to take note of risks, for example - Anhui Wantong TechnologyLtd has 1 warning sign we think you should be aware of.
If companies with solid past earnings growth is up your alley, you may wish to see this free collection of other companies with strong earnings growth and low P/E ratios.
New: Manage All Your Stock Portfolios in One Place
We've created the ultimate portfolio companion for stock investors, and it's free.
• Connect an unlimited number of Portfolios and see your total in one currency
• Be alerted to new Warning Signs or Risks via email or mobile
• Track the Fair Value of your stocks
Have feedback on this article? Concerned about the content? Get in touch with us directly. Alternatively, email editorial-team (at) simplywallst.com.
This article by Simply Wall St is general in nature. We provide commentary based on historical data and analyst forecasts only using an unbiased methodology and our articles are not intended to be financial advice. It does not constitute a recommendation to buy or sell any stock, and does not take account of your objectives, or your financial situation. We aim to bring you long-term focused analysis driven by fundamental data. Note that our analysis may not factor in the latest price-sensitive company announcements or qualitative material. Simply Wall St has no position in any stocks mentioned.
About SZSE:002331
Anhui Wantong TechnologyLtd
Primarily engages in the provision of full-scenario intelligent solutions for the transportation industry in China.
Adequate balance sheet and slightly overvalued.
Market Insights

Advertisement
Community Narratives
The company that turned a verb into a global necessity and basically runs the modern internet, digital ads, smartphones, maps, and AI.
Fair Value US$300.00|8.5% undervalued
OS
Community Contributor
Flowers Foods Pays A Fair Price For Health
Fair Value US$16.12|24.6% undervalued
NV
Community Contributor
TMX Group will thrive with 33.3% profit margin and enduring market moat
Fair Value CA$49.90|0.1% undervalued
LI
Community Contributor