
Advertisement
Hangzhou Hopechart IoT Technology Co.,Ltd (SHSE:688288) Looks Inexpensive After Falling 28% But Perhaps Not Attractive Enough
To the annoyance of some shareholders, Hangzhou Hopechart IoT Technology Co.,Ltd (SHSE:688288) shares are down a considerable 28% in the last month, which continues a horrid run for the company. The drop over the last 30 days has capped off a tough year for shareholders, with the share price down 41% in that time.
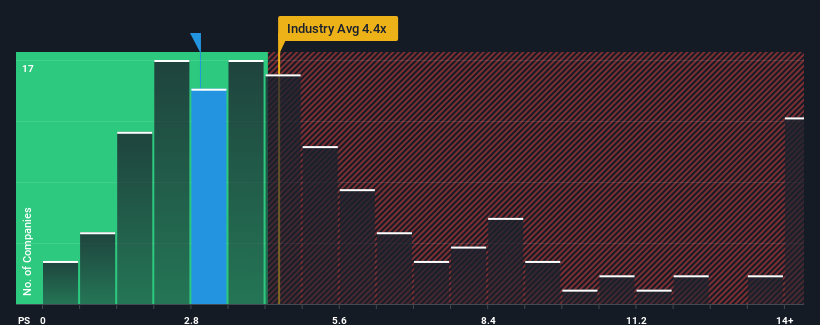
After such a large drop in price, Hangzhou Hopechart IoT TechnologyLtd may be sending bullish signals at the moment with its price-to-sales (or "P/S") ratio of 3x, since almost half of all companies in the Software industry in China have P/S ratios greater than 4.4x and even P/S higher than 8x are not unusual. Although, it's not wise to just take the P/S at face value as there may be an explanation why it's limited.
Check out our latest analysis for Hangzhou Hopechart IoT TechnologyLtd
How Hangzhou Hopechart IoT TechnologyLtd Has Been Performing
Hangzhou Hopechart IoT TechnologyLtd certainly has been doing a great job lately as it's been growing its revenue at a really rapid pace. It might be that many expect the strong revenue performance to degrade substantially, which has repressed the P/S ratio. If that doesn't eventuate, then existing shareholders have reason to be quite optimistic about the future direction of the share price.
We don't have analyst forecasts, but you can see how recent trends are setting up the company for the future by checking out our free report on Hangzhou Hopechart IoT TechnologyLtd's earnings, revenue and cash flow.How Is Hangzhou Hopechart IoT TechnologyLtd's Revenue Growth Trending?
Hangzhou Hopechart IoT TechnologyLtd's P/S ratio would be typical for a company that's only expected to deliver limited growth, and importantly, perform worse than the industry.
Taking a look back first, we see that the company grew revenue by an impressive 70% last year. However, this wasn't enough as the latest three year period has seen the company endure a nasty 11% drop in revenue in aggregate. So unfortunately, we have to acknowledge that the company has not done a great job of growing revenues over that time.
In contrast to the company, the rest of the industry is expected to grow by 30% over the next year, which really puts the company's recent medium-term revenue decline into perspective.
In light of this, it's understandable that Hangzhou Hopechart IoT TechnologyLtd's P/S would sit below the majority of other companies. Nonetheless, there's no guarantee the P/S has reached a floor yet with revenue going in reverse. Even just maintaining these prices could be difficult to achieve as recent revenue trends are already weighing down the shares.
What Does Hangzhou Hopechart IoT TechnologyLtd's P/S Mean For Investors?
Hangzhou Hopechart IoT TechnologyLtd's recently weak share price has pulled its P/S back below other Software companies. It's argued the price-to-sales ratio is an inferior measure of value within certain industries, but it can be a powerful business sentiment indicator.
It's no surprise that Hangzhou Hopechart IoT TechnologyLtd maintains its low P/S off the back of its sliding revenue over the medium-term. At this stage investors feel the potential for an improvement in revenue isn't great enough to justify a higher P/S ratio. Given the current circumstances, it seems unlikely that the share price will experience any significant movement in either direction in the near future if recent medium-term revenue trends persist.
There are also other vital risk factors to consider before investing and we've discovered 2 warning signs for Hangzhou Hopechart IoT TechnologyLtd that you should be aware of.
Of course, profitable companies with a history of great earnings growth are generally safer bets. So you may wish to see this free collection of other companies that have reasonable P/E ratios and have grown earnings strongly.
Valuation is complex, but we're here to simplify it.
Discover if Hangzhou Hopechart IoT TechnologyLtd might be undervalued or overvalued with our detailed analysis, featuring fair value estimates, potential risks, dividends, insider trades, and its financial condition.
Access Free AnalysisHave feedback on this article? Concerned about the content? Get in touch with us directly. Alternatively, email editorial-team (at) simplywallst.com.
This article by Simply Wall St is general in nature. We provide commentary based on historical data and analyst forecasts only using an unbiased methodology and our articles are not intended to be financial advice. It does not constitute a recommendation to buy or sell any stock, and does not take account of your objectives, or your financial situation. We aim to bring you long-term focused analysis driven by fundamental data. Note that our analysis may not factor in the latest price-sensitive company announcements or qualitative material. Simply Wall St has no position in any stocks mentioned.
About SHSE:688288
Hangzhou Hopechart IoT TechnologyLtd
Engages in the development, production, and sale of driving systems and advanced driver assistance systems (ADAS) in the People’s Republic of China.
Excellent balance sheet and slightly overvalued.
Market Insights

Advertisement
Weekly Picks
RO


RockeTeller on Santacruz Silver Mining ·
Crazy Undervalued 42 Baggers Silver Play (Active & Running Mine)
Fair Value:CA$8696.7% undervalued
50 followersusers have followed this narrative
6 commentsusers have commented on this narrative
16 likesusers have liked this narrative
RO


Robbo on Fiducian Group ·
Fiducian: Compliance Clouds or Value Opportunity?
Fair Value:AU$122.0% undervalued
8 followersusers have followed this narrative
0 commentsusers have commented on this narrative
0 likesusers have liked this narrative
WO

woodworthfund on Willamette Valley Vineyards ·
Willamette Valley Vineyards (WVVI): Not-So-Great Value
Fair Value:US$242.5% overvalued
10 followersusers have followed this narrative
0 commentsusers have commented on this narrative
1 likeusers have liked this narrative
Recently Updated Narratives
MO


mo7md on ADNOC Gas ·
ADNOC Gas future shines with a 21.4% revenue surge
Fair Value:د.إ3.728.9% undervalued
2 followersusers have followed this narrative
0 commentsusers have commented on this narrative
0 likesusers have liked this narrative
IN

IncomeAssets on Pulse Seismic ·
Watch Pulse Seismic Outperform with 13.6% Revenue Growth in the Coming Years
Fair Value:CA$4.4727.3% undervalued
3 followersusers have followed this narrative
0 commentsusers have commented on this narrative
0 likesusers have liked this narrative
VL

Vladislav on Galleon Gold ·
Significantly undervalued gold explorer in Timmins, finally getting traction
Fair Value:CA$481.5% undervalued
7 followersusers have followed this narrative
0 commentsusers have commented on this narrative
0 likesusers have liked this narrative
Popular Narratives
TH


TheWallstreetKing on MicroVision ·
MicroVision will explode future revenue by 380.37% with a vision towards success
Fair Value:US$6098.5% undervalued
116 followersusers have followed this narrative
11 commentsusers have commented on this narrative
22 likesusers have liked this narrative
AN


AnalystConsensusTarget on NVIDIA ·
NVDA: Expanding AI Demand Will Drive Major Data Center Investments Through 2026
Fair Value:US$250.3927.2% undervalued
957 followersusers have followed this narrative
6 commentsusers have commented on this narrative
25 likesusers have liked this narrative
RO
RockeTeller on Santacruz Silver Mining ·
Crazy Undervalued 42 Baggers Silver Play (Active & Running Mine)
Fair Value:CA$8696.7% undervalued
50 followersusers have followed this narrative
6 commentsusers have commented on this narrative
16 likesusers have liked this narrative

